
Have you ever wanted to know what the video game market went through in past decades? How far have we come from Pong and the Magnavox Odyssey? What has been the trajectory for the video game market and how successful has it been in the last 50 (or so) years?
Numbers for the success and size of the video game market are readily searchable on the internet, but hardly any of them are sourced. Worse still, modern sources are not close enough to the events to have much of a chance of being accurate. Much of that data has been lost to time.
At Gaming Alexandria, we have gathered some of the best estimates for the video game market from the commercial beginnings of the industry from 1972 up to the turn of the millennium in 1999. This post covers available numbers for: Overall unit sales and revenue for home consoles, handheld consoles, and arcade games.
We must start with some caveats. The most important one: All of these figures are estimates done by analyst groups or publications. Reports rarely, if ever, had access to internal sales figures to reconstruct a totally accurate picture of what was sold by individual companies. Some of these estimates are solid, some are less so. We will not be providing an in-depth explanation of how analysts get their figures and who to rely on, but the posts for each year will point towards the most likely accurate estimates for the time. These will hopefully provide a better overall trajectory for video games than has existed in the past, if not completely accurate numbers.
We are also not going to attempt to reconstruct data from years analysts have no info for. For instance, if we couldn’t find estimated unit sales of individual consoles – say Atari announces their Atari 7800 sales one year – we’re not attempting to plug in the sales of other consoles to come up with a number. Firstly, because this tends to ignore consoles with small unit sales that analysts would have taken into account – like say the Turbographx-16 in 1993. It also rests on the reliability of company sales figures which were sometimes easy to manipulate by the companies, countering actual retail sales.
We will also not be using sources which are more than five years old from the year they cover – with the exception of the years from 1972-1977 where there is less data. After about five years, a lot of analysts appear to forget the earlier data and start making wild estimations which contradict the old. As historians will tell you, evidence from closer to the events tends to be better in terms of reliability. Even the NPD tracking group – the chief tracking group for video games sales – disavows their pre-1995 figures.
The data will only cover the United States, though we are gathering information for similar posts on Europe and Japan. Europe also had a large computer game scene, but figures are a bit harder to come by. In the future we intend to do posts on computer games and other territories, but we are restricting this look to video game consoles, coin-operated video games, and handheld video games in the United States.
We highly encourage anyone to take these figures and create charts if you desire! Likewise, if you have reliable sources that match our criteria then we would be more than happy to add them to our list. We do curate sources so there’s no guarantee it will show up, but do not hesitate to send us information we may have missed.
Consider this article a first step in helping sculpt the picture of the video game market. If others want to use numbers reported by other companies, internal documents, and serial numbers to better reconstruct the past, more power to you! This is an ongoing process.
For now we hope you enjoy a bit of commentary on the rise and fall… Then rise and fall… And hopefully now just a rise of video games.
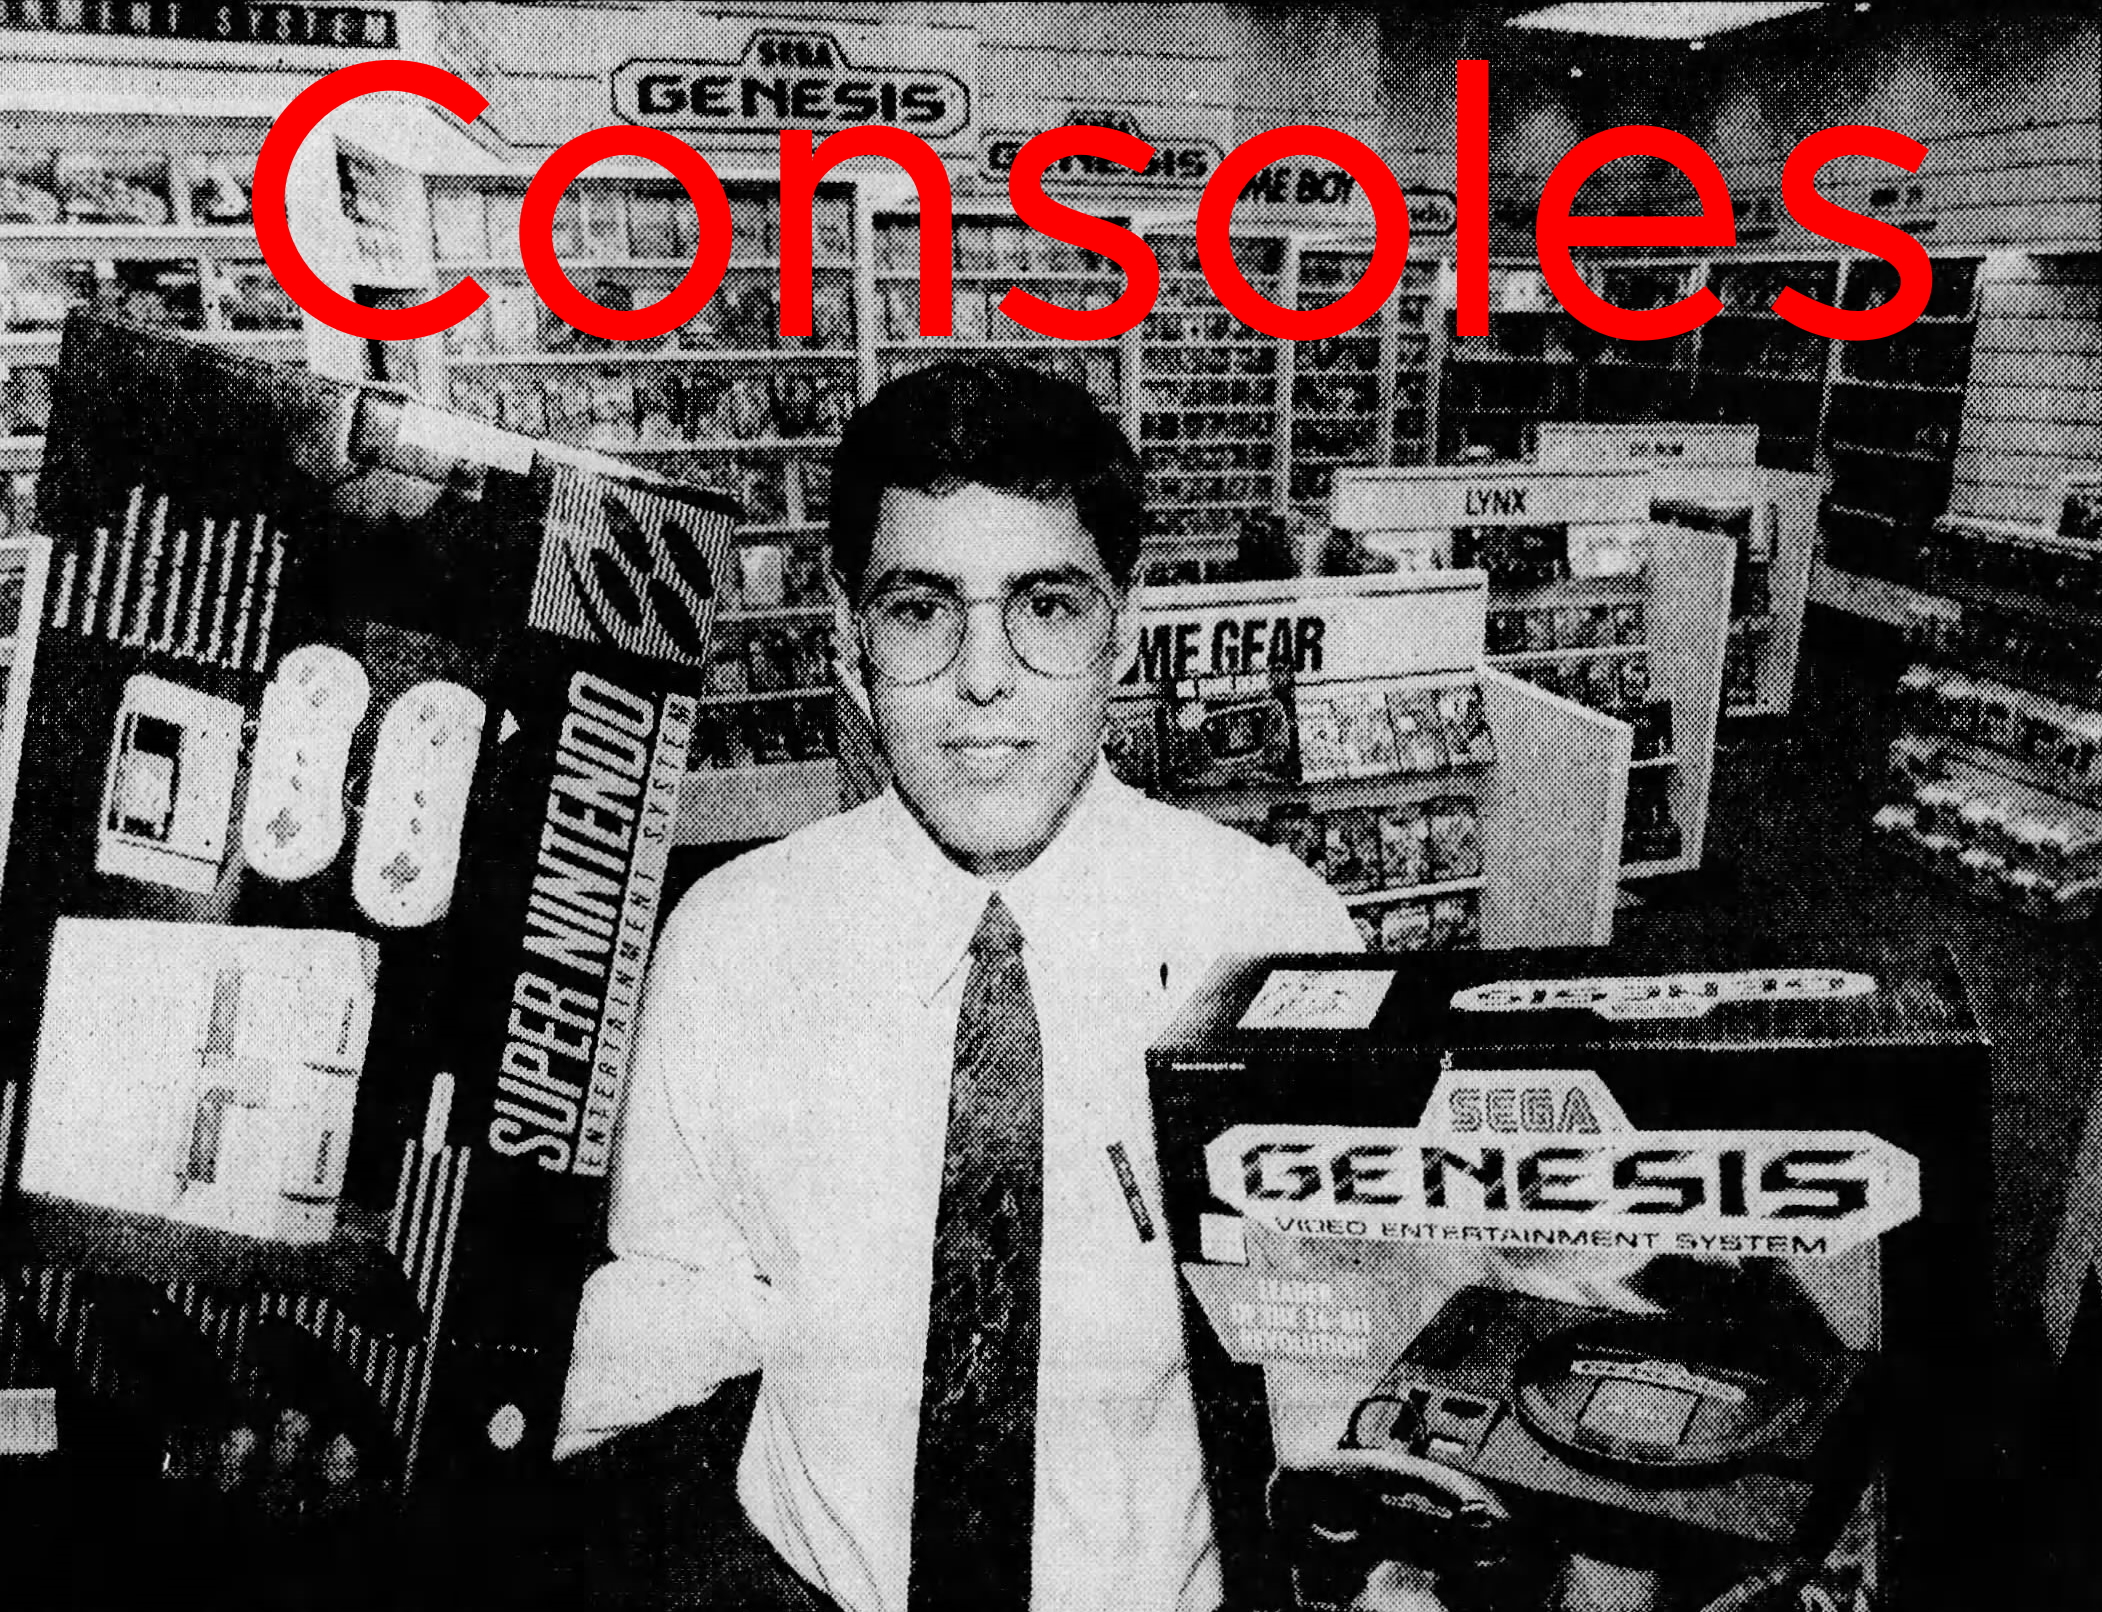
Consoles

Console Units: 33,000 (1983-02 The Electronic Games Market in the US)
Console Revenue (Retail): $1.7 million (1983-02 The Electronic Games Market in the US)
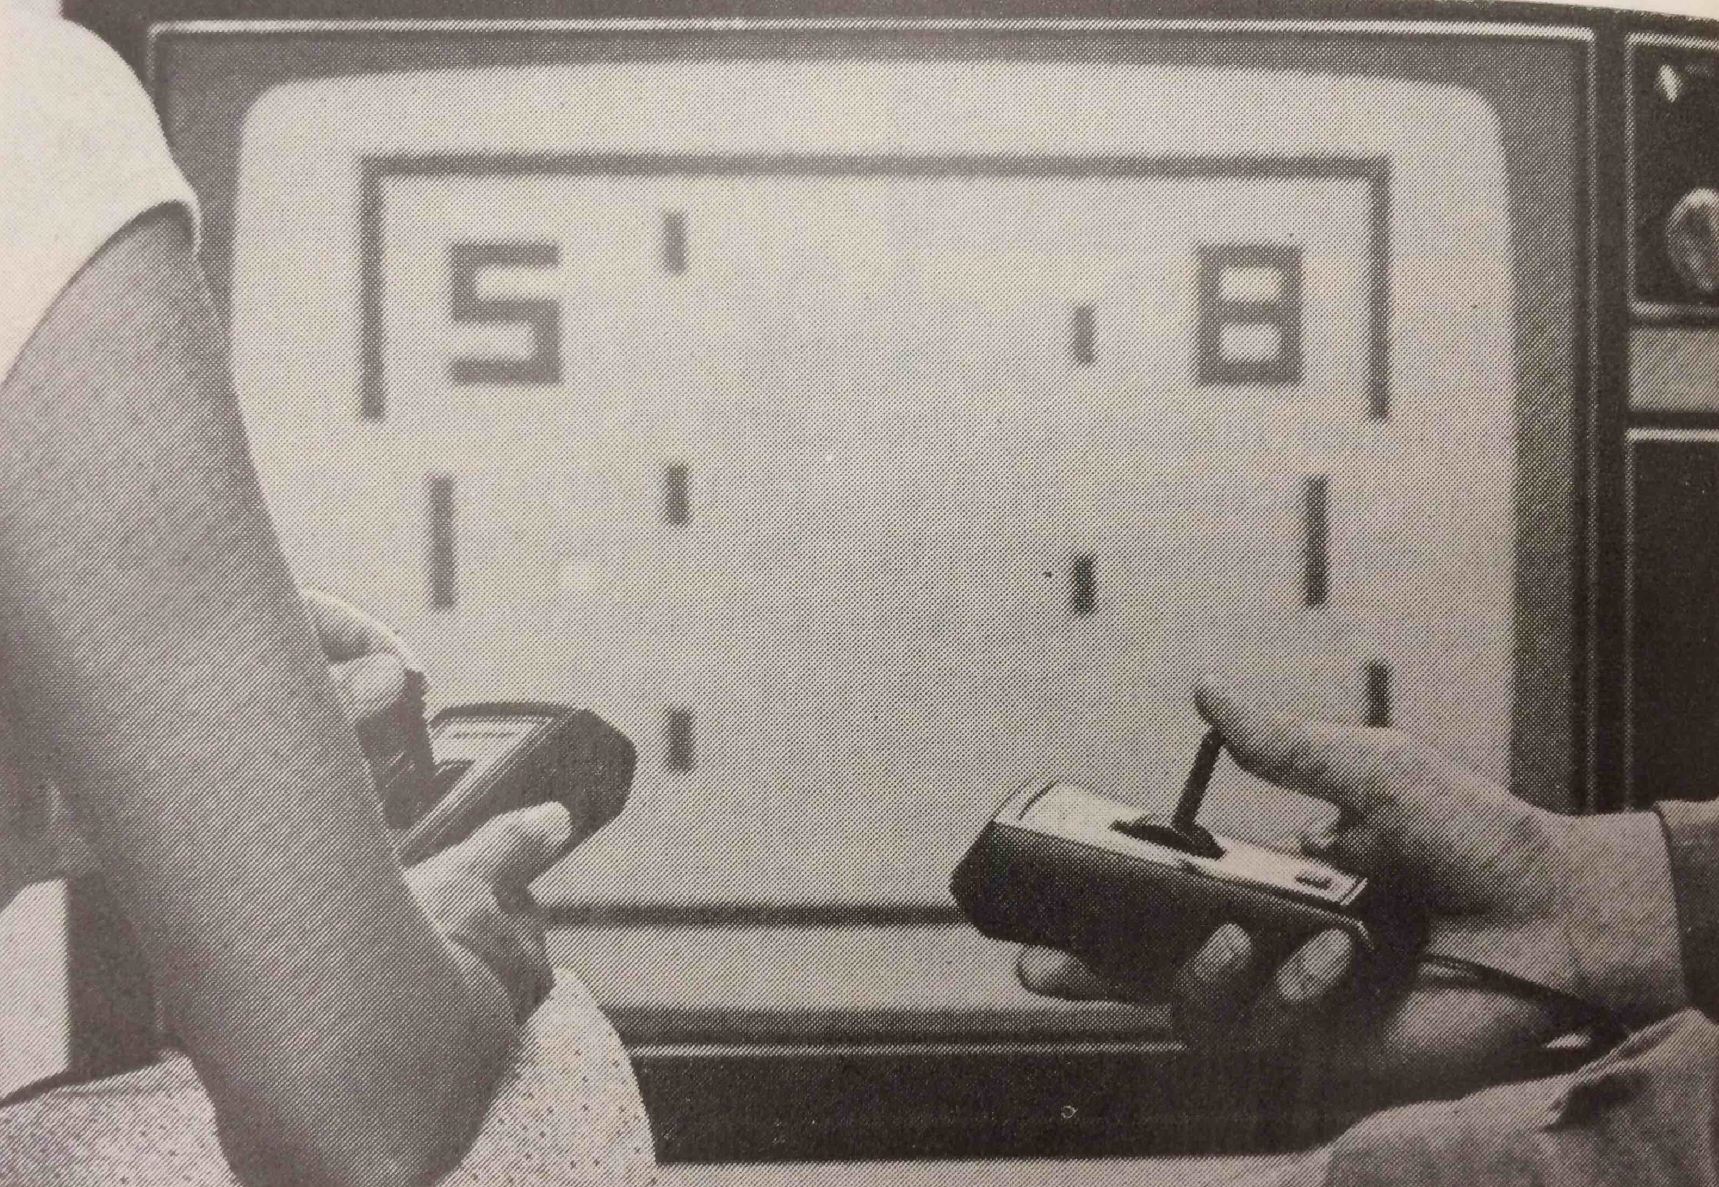
In 1972 we had the release of Magnavox’s Odyssey console in about September of that year. It was the only console available at the time and so initially we have only Magnavox insider sources. In 1983, the estimates jumped considerably, but it is best to rely on those initial reports.
As reported by Gaming Alexandria friend Alex Smith in his book They Create Worlds, after positive feedback in early test markets Magnavox decided to produce 140,000 consoles for the first Holiday season. 69,000 were ultimately sold that year – an official figure from Magnavox. This left them with unsold inventory and nearly canceled the project – an inauspicious first year of the video game console market.

Console Units: 90,000 (1983-02 The Electronic Games Market in the US), 110,000 (1977-04 Mart)
Console Revenue (Retail): $4.6 Million (1983-02 The Electronic Games Market in the US)
Still only Magnavox in 1973. This time the later estimate matches up with the insider information, with a reported 89,000 units sold. This cleared out existing inventory from the prior year and then some.
Curiously the figure from Mart also claims to have come from Magnavox, but the same source also reported that the 1972 sales were only 1,000 units.
It was not a massive leap over the prior year but enough to instill confidence from Magnavox and – for the first time – competition.

Console Units: 90,000 (1976-07-21 Retail Home Furnishings), 100,000 (1976-06 The Coin Operated and Home Electronic Games Market), 145,000 (1983-02 The Electronic Games Market in the US), 150,000 (1976-03-29 Retail Home Furnishings)
Console Revenue (Retail): $9 Million (1983-02 The Electronic Games Market in the US), $11.3 Million (1976-07-21 Retail Home Furnishings)
The first year that Magnavox does not remain uncontested as several companies entered the market – primarily in Europe. Most notably, Video Action from Control Sales appears in the US, derived from one of the coin-op Pong clones.
There is some question as to whether the few other home systems could have truly factored into the equation. Magnavox’s figures for the year are 129,000 units, so the estimates are either making up for the unreported units in 1972 or are just off the mark.
Either way, this was the first six figure year, and it would only get bigger after that.

Console Units: 237,000 (1976-07-21 Retail Home Furnishings), 250,000 (1976-06 The Coin Operated and Home Electronic Games Market), 310,000 (1976-12-25 Daily News pg 22, 1977-01 Appliance Manufacturer, 1983-02 The Electronic Games Market in the US), 350,000 (1976-05 Merchandising, 1980-03 Merchandising), 400,000 (1976-03-29 Retail Home Furnishings, 1977-02-25 The Tampa Times pg 1-B)
Console Revenue (Unspecified): $3 Million (1977-02-25 The Tampa Times pg 1-B), $15 Million (1982-12-10 The Bradenton Herald pg A-7), $17 million (1976-06 The Coin Operated and Home Electronic Games Market)
Console Revenue (Wholesale): $22 Million (1977-01 Appliance Manufacturer)
Console Revenue (Retail): $10-20 Million (1976-12-25 The Daily News (New York) pg 22), $32 Million (1976-07-21 Retailing Home Furnishings), $40 Million (1976-03-29 Retail Home Furnishings, 1976-11-22 Electronics News, 1977-01-06 Electronics, 1983-02 The Electronic Games Market in the US).
At this point, we’ll stop talking about the individual console unit sales (that will be for a future article). The market has moved beyond a single dominant player in the era of the “dedicated console,” I.E. a hardwired video game machine that can only play the games built in with it
Pong derivatives flood retail stores around the nation. Magnavox had their Odyssey 100 and 200 models, Atari had their home Pong console, and many other early birds of less note held up the rear. 1975 was the year in which console video games truly became an industry, rather than a curiosity.
This being the first year we have multiple contradictory sources, discrepancy is starting to creep in. The unit difference is not that big of a deal. We personally believe that 310,000-350,000 consoles sold is a good general estimate. Particularly among these sources is Merchandising, which sticks to their numbers over their years reporting on the industry without constant revision. (Thanks to friend of GA Kevin Bunch for providing scans of Merchandising used for this project.)
In revenue, we included Wholesale, Retail, and Unspecified. Wholesale is the value of the inventory sold by the console manufacturers to the retailers. At Retail, they up the price they purchased it for to sell it to the consumer. Retail should always be higher than Wholesale – traditionally around double or less (a console is $100 at Retail, they probably purchased it for around $50 Wholesale). Unspecified means that the source does not say whether it is reporting Wholesale or Retail figures, so we decline to report them as one way or the other – though it often serves as important evidence.
Take, for instance, the source “The Electronic Games Market in the US.” It reports $17 million in Unspecified revenue from console sales, but also reports $40 million when sold at Retail. This likely means that the Unspecified revenue in this case is Wholesale numbers, as is much of the rest in that same category.
We’re lucky that in this year, a lot of figures including those close to the events hover around that $40 million figure with some consistency. Standard retail price for consoles in this year was around $70-100, which does create a discrepancy if you do straight division of figures. However, in many places around the country – especially department stores – sales were not standardized. Atari’s Pong may have sold at a price above the MSRP of $100 in some places, which increases revenue without moving more consoles. There were also more expensive models outside of the big two.
This is our main launching point for the console market. From here on out, analysts and consumers are both very interested in the results of video games in the home.

Console Units: 3.24 Million [3.2 Million dedicated, 40,000 programmable] (1983-02 The Electronic Games Market in the US), 3.3 Million (1977-03 Merchandising), 3.39 Million (1977 Gametronics Proceedings), 3.5 Million (1976-12-25 Daily News pg 22), 3.55 Million [3.45 Million dedicated, 100,000 programmable] (1978-03 Merchandising), 3.6 Million (1977-12-09 The Memphis Press-Scimitar pg 6), 4 Million [3.95 million dedicated, 50,000 programmable] (1977-01-24 Electronics News, 1977-04-04 Electronics News, 1977-07 Playthings)
Console Revenue (Unspecified): $225 Million (1977-04-04 Electronic News)
Console Revenue (Retail): $125 Million (1977-01-06 Electronics), $134 Million [$125 Million dedicated, $9 million programmable] (1983-02 The Electronic Games Market in the US), $150,500,000 (1980-03 Merchandising), $187 Million (1977 Gametronics Proceedings), $200 Million (1976-12-25 Daily News pg 22), $225 Million (1977-12-09 The Memphis Press-Scimitar pg 6)
In this year we have both the introduction of the Pong-on-a-chip consoles as well as the first programmable console with the Channel F from Fairchild. As such we have a delineation in figures, but the unit sales remain remarkably consistent across the spectrum. Unfortunately we have no figures directly from Fairchild to cross-reference but it still would likely not get us any closer than the span of 3.25-3.5 million overall console sales. The only thing to take away from that alone is programmable consoles were a small fraction of the market at their debut.
For the revenue picture there’s a hovering around $150 million, with the spare $200 million figure making things more complicated. While normally I would say the higher figure is the real retail value, every source higher than $150 million has some issues. Gametronics for instance had a very flawed way of calculating its numbers, The Daily News hadn’t yet reached the end of the year, and Electronic News didn’t specify its numbers to what market.
It may be possible that $150 million actually represents a wholesale number, but that would represent an absolutely titanic leap over the prior year’s potential wholesale as opposed to a measly 4 times growth. Pong-on-a-chip consoles were a big fad, but they were still relatively expensive. In this case again I’ll hem to Merchandising even though their figure was calculated later.

Console Units: [500,000 programmable] (1982-12 Video Game Industry: Strategic Research), 5.175 Million [5 Million dedicated, 175,000 programmable] (1978-03 Merchandising, 1979-03 Merchandising), 5.42 Million [4.87 Million dedicated, 550,000 programmable] (1978-08 Merchandising, 1980-03 Merchandising), 6 Million [5.5 Million dedicated, 500,000 programmable] (1983-02 The Electronic Games Market in the US), 6 Million [5.4 million dedicated, 600,000 programmable] (1978-01 Journal of Asia Electronics Union), 7.45 million [7 million dedicated, 450,000 programmable] (1979-03 Home & Coin Operated Electronic Games), 8.5 million [7.5 million dedicated, 1 million programmable] (1979-02 Electronic Games & Personal Computers)
Console Revenue (Unspecified): [$63 million programmable] (1982-12 Video Game Industry: Strategic Research), $230,400,000 [$229 million dedicated, $1.4 million programmable] (1976-11-29 Electronic News), $258,000,000 [$210 million dedicated, $48 million programmable] (1979-03 Home & Coin Operated Electronic Games),
Console Revenue (Wholesale): $280,000,000 (1978-01-05 Electronics)
Console Revenue (Retail): $248,625,000 (1979-03 Merchandising), $263,550,000 (1980-03 Merchandising), $325 Million [$230 Million dedicated, $95 Million programmable] (1983-02 The Electronic Games Market in the US)
Game Units: 1.1 million cartridges (1982-12 Video Game Industry: Strategic Research), 2.5 Million cartridges (1979-03 Home & Coin Operated Electronic Games)
Game Revenue (Unspecified): $14 million in cartridges (1982-12 Video Game Industry: Strategic Research)
Game Revenue (Wholesale): $36 million in cartridges (1979-03 Home & Coin Operated Electronic Games)
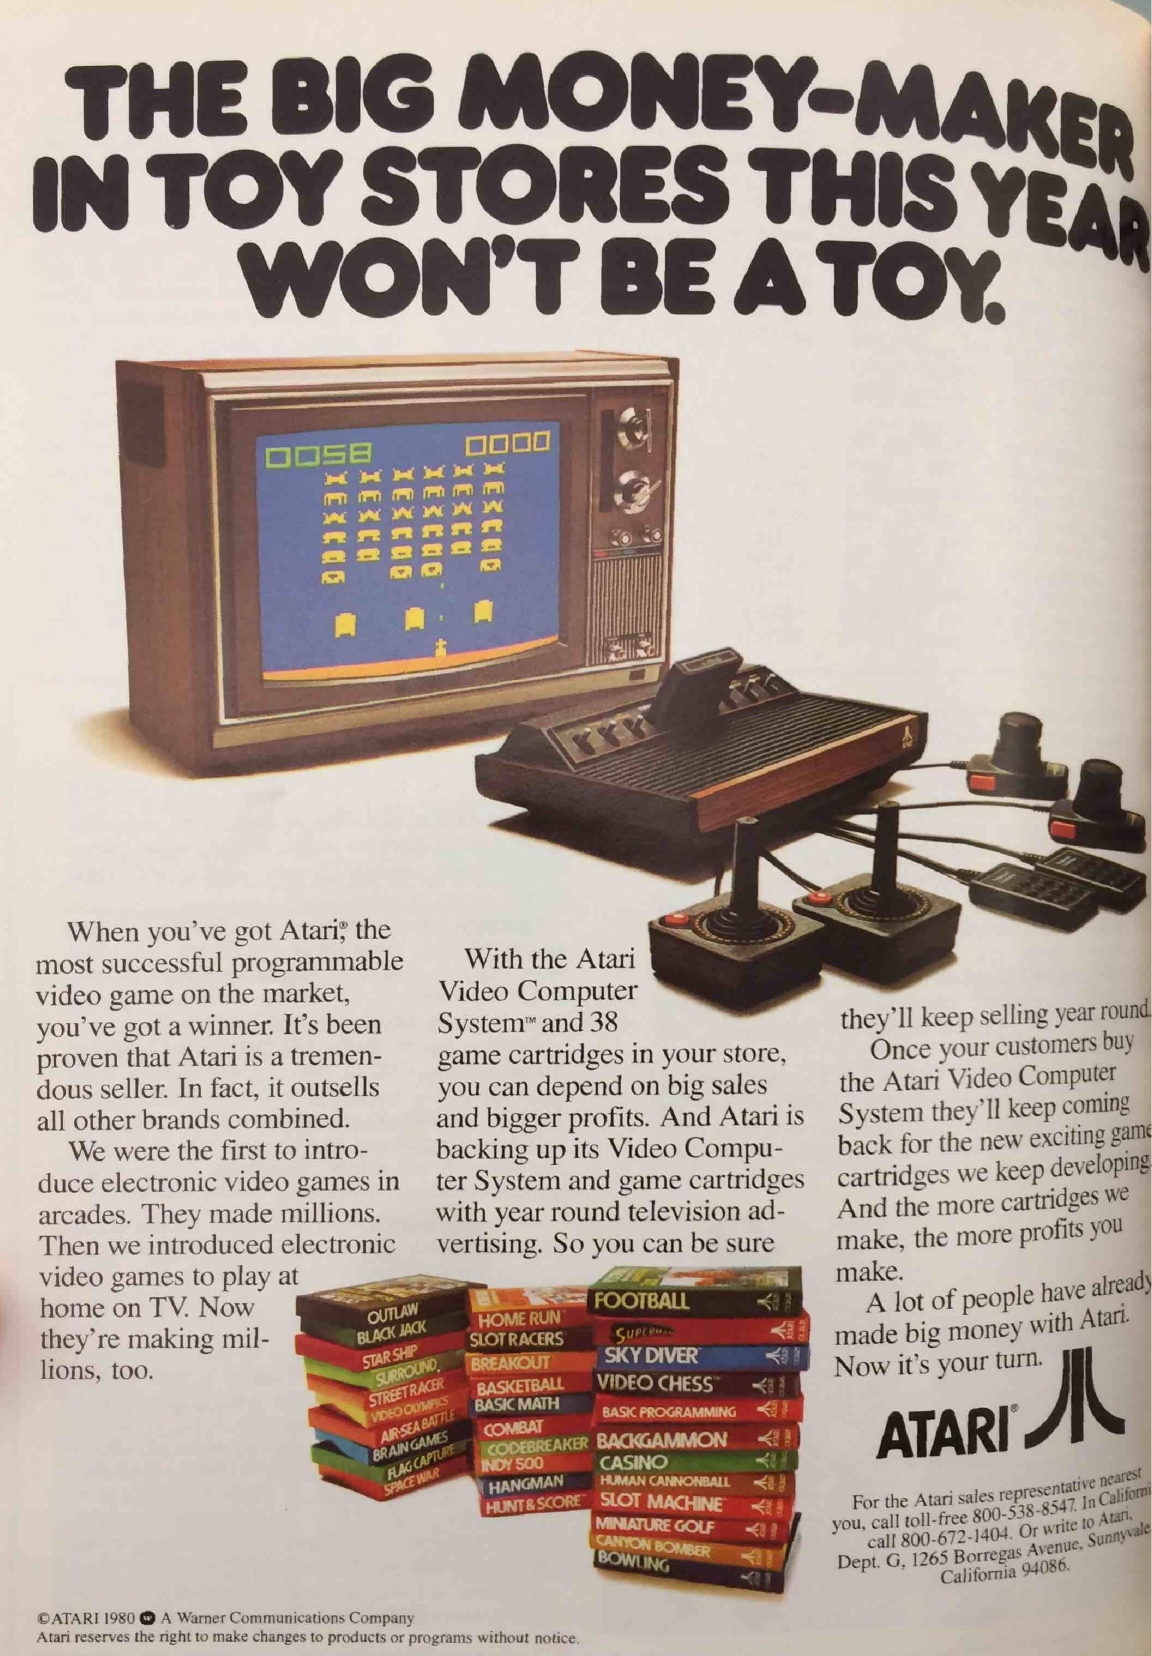
In 1977 we expand to our full categories with game unit (cartridge) sales and finally reach the year that analysts really began to pay attention to the market seriously. The Atari VCS hits the scene but would take some time to completely dominate the living room. RCA does their tiny amount of sales with Bally and the Odyssey 2 rolling into the next year. Programmable does much better than the tiny squirm last year, but by how much relative to the dedicated consoles?
There appears to have been a pretty widespread confusion over just how much the market expanded in 1977. Many of the figures get revised and we’re left with an initial gap of 5-8.5 million consoles. We can definitely narrow that to more like 5-6 million based on the totality of sources, but then the question remains of how successful the programmable consoles were to the overall picture.
Again we won’t be attempting to back calculate figures from every single year, but as an example we know that Atari sold 340,000 units in its first holiday season so we can rule out the extremely low figures like 175,000. That doesn’t mean we rule out the greater number though, and in the case of revenue we find ourselves in another sticky situation.
While in general the actual revenue figures are pretty close to each other in the 230-260 million pocket, what the numbers are representing is a big question mark. Nobody seems to really know and it’s not possible to simply find a double in this case. One thing we do know about this year is that by the holidays there was deep discounting of the dedicated consoles which probably meant the retail figure looked rather low in comparison to other years. In this case I’m inclined to think that the 1979 market study and the 1983 market study line up vis a vis wholesale and retail figures, with a nearly accurate doubling in programmable systems revenue.
As reported by Merchandising in 1978, the initial orders were high but an oversupply was quickly reached and this led to significant discounting which would follow into the next year. $70 systems sold for $20 which created a net loss for the retailers, leading to reluctance in the following years to stock video games. This coinciding with the moment that electronic handheld games are introduced, the atmosphere for the adoption of programmable consoles had soured.
This is the first year we get a track on cartridges, but it’s unfortunately not too helpful. The adoption rate could range between 2 and 5 cartridges per console owner and the revenue figures may be flip-flopped. Cartridges did make very high margins so it’s possible the 1979 study has it right, as they state in the book that their calculation is based on a manufacturers’ selling price of $14.30. Were cartridges adopted so widely though? That will remain in the air for now.

Console Units: [700,000 programmable] (1982-12 Video Game Industry: Strategic Research), [2.1 Million programmable] (1979-04 Byte pg 193), 2.2 Million [1.6 Million dedicated, 600,000 programmable] (1983-02 The Electronic Games Market in the US), 2.585 Million [1.8 Million dedicated, 785,000 programmable] (1979-03 Merchandising, 1980-03 Merchandising), 6.9 million [6 Million dedicated, 0.9 Million programmable] (1979-03 Home & Coin Operated Electronic Games)
Console Revenue (Unspecified): [$109.5 million programmable] (1982-12 Video Game Industry: Strategic Research)
Console Revenue (Wholesale): $219 million [$120 million dedicated, $99 million programmable] (1979-03 Home & Coin Operated Electronic Games)
Console Revenue (Retail): $163,075,000 (1979-03 Merchandising), $250 Million [$120 Million dedicated, $130 Million programmable] (1983-02 The Electronic Games Market in the US)
Game Units: 2.7 million cartridges (1982-12 Video Game Industry: Strategic Research), 5.7 Million cartridges (1979-04 Byte pg 193), 6 million cartridges (1979-03 Home & Coin Operated Electronic Games)
Game Revenue (Unspecified): $18 Million in cartridges (1979-04 Byte pg 193), $36.3 Million in cartridges (1982-12 Video Game Industry: Strategic Research)
Game Revenue (Wholesale): $86 million in cartridges (1979-03 Home & Coin Operated Electronic Games)
Console and Game Revenue: $215 Million (1984 A Competitive Assessment of the U.S. Video Game Industry)
When the figures start to get a bit wonky, you know something’s wrong with the market. Indeed in 1977 there was a shakeout in the dedicated console market along with the introduction of handheld games which led to the revenue for 1978 to totally stagnate or decline depending on the number you believe. Unit sales are a complete mess where you can tell some conflation has been had between pure programmable numbers and overall console sales, with the likes of Byte magazine only caring about the former. The 1979 study clearly based their final numbers off of early estimates tracking from the prior year which turned out to be horribly false.
With the reliable figures we see the collapse of dedicated consoles yielding a figure of 2.1-2.6 million in all, with around a third being taken up by the rising star of programmables. Once more we have an unfortunate crossing of the line with revenue figures, again having to account for the discounting that became even more extreme in 1978. It’s possible the two “retail” figures – Merchandising and the 1983 study – make for a nice pairing of wholesale and retail respectively.
As for cartridges, the 1979 study again seems to taint the well with early expectations that weren’t properly measured out once 1978 was over. I’m just going to say it’s highly unlikely that cartridge sales multiplied so much while the rest of the market was so stagnant. The figure appears to properly double along with the sales of the consoles that support them, though this should be balanced against the prior year’s sales for a proper attach rate estimate.
We also have our first overall industry estimate, though it is from a much later study. These will become more common and make it difficult to separate the different aspects of the industry, sometimes even throwing in merchandise just to get a higher number. Take these as potential anchor points if you want to sort out the exact figures, knowing that it’s unlikely the total market figure would be completely overtaken.

Console Units: [800,000 programmable] (1982-12 Video Game Industry: Strategic Research), 1.55 Million [800,000 dedicated, 750,000 programmable] (1983-02 The Electronic Games Market in the US), 1.685 Million (1980-03 Merchandising)
Console Revenue (Unspecified): $137 million (1982-12 Video Game Industry: Strategic Research)
Console Revenue (Retail): $105,955,000 (1980-03 Merchandising), $233 Million [$48 Million dedicated, $185 Million programmable] (1983-02 The Electronic Games Market in the US)
Game Units: 3.7 million cartridges (1982-12 Video Game Industry: Strategic Research), 4 Million cartridges (1982-10 Software Merchandising Magazine, 1983-01-08 The Modesto Bee pg C7)
Game Revenue (Unspecified): $48.7 million (1982-12 Video Game Industry: Strategic Research)
Total stagnation hits the industry in 1979, with interest in dedicated consoles completely shot and programmable consoles hitting a brick wall. This does create – for the first time – a parity between the two categories, foreshadowing that programmable consoles were about to take over. Unfortunately, no one knew if the market was going to properly grow and therefore analysts lost interest in the industry, so our figures are scant.
Not all was doom and gloom though. With the programmable systems, the revenue figure was looking much healthier. If we are to believe the 1983 market study, on average a programmable console was quintuple the price of a dedicated console and the interest remained steady enough to work with. The Merchandising figures again do actually seem to be pointing to wholesale revenue, despite their label.
Cartridge figures appear to be pretty consistent across a few different sources. Not doubling, but showing that the interest in the games could actually outpace the sale of the consoles. This was borne out in Atari’s accelerated release schedule in 1979, which you can learn a bit more about from the Atari Archive series by Gaming Alexandria friend Kevin Bunch. Overall though, everything was in a decline. The compelling reason to own a console had not yet appeared and things seemed to be falling into disrepair.

Console Units: [1.7 million programmable] (1982-12 Video Game Industry: Strategic Research), 1.92 Million [270,000 dedicated, 1.65 Million programmable] (1983-02 The Electronic Games Market in the US), 2 Million (1981-04-03 The Tampa Tribune pg 6-D), 2.2 Million (1982-10 Software Merchandising Magazine, 1985 Consumer Electronics Annual Review)
Console Revenue (Unspecified): $202 million [programmable] (1982-12 Video Game Industry: Strategic Research)
Console Revenue (Wholesale): $325 Million (1983-12-04 Arizona Republic pg G8)
Console Revenue (Retail): $493 Million [$18 Million dedicated, $475 Million programmable] (1983-02 The Electronic Games Market in the US)
Game Units: 8.2 million cartridges (1982-12 Video Game Industry: Strategic Research), 8.7 Million cartridges (1983-02 The Electronic Games Market in the US), 9 Million cartridges (1982-10 Software Merchandising Magazine, 1985 Consumer Electronics Annual Review), 9.5 Million cartridges (1982-06-15 The Philadelphia Inquirer pg Advertising 2)
Game Revenue (Unspecified): $120.8 million from cartridges (1982-12 Video Game Industry: Strategic Research)
Game Revenue (Wholesale): $115 Million from cartridges (1982-02-24 The Shreveport Journal pg 14C), $130 Million from cartridges (1983-12-04 Arizona Republic pg G8)
In the course of a few months, Atari changed the trajectory of the console market with the release of Space Invaders for the VCS. This would be the year which changed the fortunes of the company and created the rising tide which lifted all boats who were in on this console thing. It was also just about the last year that dedicated consoles would be reported, as their market shrank to nothing worth caring about in the face of the huge explosion in programmable sales. Dedicated consoles would hold out longer in Europe, but that’s beyond the scope of this list.
This may be the first year that the data is probably very close to reliable as the aftermarket studies are mirrored by contemporaneous newspaper reports which predate them. A scant 200,000-300,000 dedicated consoles held on in a sea of about 1.7 million programmable, adding up to a retail figure of about $500 million. Games would see a triumph in interest with doubled cartridge sales at about 8.5 million and rake in a revenue figure of about $120 million. Nice and simple.

Console Units: 3 Million (1982-05-12 The Times Shreveport/Bossier pg B1), 4.2 Million (1982-10 Software Merchandising Magazine, 1983-02 The Electronic Games Market in the US, 1985 Consumer Electronics Annual Review), 4.62 Million (1983-12 Software Strategies: The Home Computer and Videogame Marketplace). 4.7 Million (1982-12 Video Game Industry: Strategic Research)
Console Revenue (Unspecified): $577 Million (1983-12 Software Strategies: The Home Computer and Videogame Marketplace), $607 Million (1982-12 Video Game Industry: Strategic Research)
Console Revenue (Retail): $1.463 Billion [$8 million dedicated, $1.455 Billion programmable] (1983-02 The Electronic Games Market in the US)
Game Units: 27 Million cartridges (1982-06-15 The Philadelphia Inquirer pg Advertising 2), 28-30 Million cartridges (1983-02 The Electronic Games Market in the US), 30 million cartridges (1982-10 Software Merchandising Magazine, 1982-12 Video Game Industry: Strategic Research, 1983-01-14 Arizona Republic pg E4, 1985 Consumer Electronics Annual Review), 34.5 Million cartridges (1983-12 Software Strategies: The Home Computer and Videogame Marketplace)
Game Revenue (Unspecified): $469 million from cartridges (1982-12 Video Game Industry: Strategic Research)
Game Revenue (Wholesale): $1 Billion (1982-06-15 The Philadelphia Inquirer pg Advertising 2)
Game Revenue (Retail): $800 Million from cartridges (1983-12 Software Strategies: The Home Computer and Videogame Marketplace)
Analysts love things when they double and it appears the home console market exceeded such expectations in 1981. 4.2 million console sales appears to be a pretty stable number with $600 million coming into the manufacturer’s pockets. The higher retail revenue figure tracks well with the adoption of more expensive premium consoles like the Intellivision, and being over a billion was a wake up call for the financial trackers who had slept on video games so far.
1981 once again has a nice, stable cartridge figure of 30 million which well and proved the efficacy of releasing games outside of the holiday season. The final retail figure of $800 million in cartridges also shows that the take on cartridges had increased with the likes of premium 4K cartridges becoming the norm with leaders like Activision in the mix. The console market had truly shown what it was made of, but in this year the seeds were being sewn for the grand collapse.

Console Units: 7.03 Million (1983-02 The Electronic Games Market in the US), 7.95 Million (1983-12 Software Strategies: The Home Computer and Videogame Marketplace), 8 Million (1984-01-10 St Louis Post-Dispatch pg 6C), 8.2 million (1984-01-11 The Atlanta Constitution pg 1-C, 1984-09-20 Star Tribune pg 10B, 1985 Edition Electronic Market Data Book, 1985 Consumer Electronics Annual Review, 1986-12-22 Star Tribune pg 1C), 9 Million (1985 Nonextrapolative methods in business forecasting: scenarios, vision, and issues management), 9.5 Million (1983-09 Creative Computing)
Console Revenue (Unspecified): $997 million (1982-12 Video Game Industry: Strategic Research), $1.32 Billion (1983-12 Software Strategies: The Home Computer and Videogame Marketplace)
Console Revenue (Wholesale): $950 million (1987-02-13 The Kansas City Times pg C-3), $990 Million (1983-12-04 Arizona Republic pg G8)
Console Revenue (Retail): $1.08 Billion (1983-02 The Electronic Games Market in the US)
Game Units: 54.56 Million cartridges (1983-02 The Electronic Games Market in the US), 60 million cartridges (1983-01-23 The Courier-Journal pg G5, 1983-06 High Technology, 1983-12 Software Strategies: The Home Computer and Videogame Marketplace, 1984-01-10 St Louis Post-Dispatch pg 6C, 1985 Consumer Electronics Annual Review), 65 Million (1983-01-30 The Miami Herald pg 6C), 80 Million cartridges (1984-05-23 Philadelphia Daily News pg 41)
Game Revenue (Unspecified): $1.175 Billion in cartridges (1982-12 Video Game Industry: Strategic Research), $1.2 Billion in cartridges (1983-06 High Technology)
Game Revenue (Wholesale): $1.1 Billion in cartridges (1983-12-04 Arizona Republic pg G8),
Game Revenue (Retail): $1.222 Billion in cartridges (1983-02 The Electronic Games Market in the US), $1.5 Billion in cartridges (1983-12 Software Strategies: The Home Computer and Videogame Marketplace)
Console and Game Revenue (Retail): $2.303 Billion (1983-02 The Electronic Games Market in the US)
Console and Game Revenue (Unspecified): $2.2 Billion (1983-06 High Technology), $3.7 Billion (1984 A Competitive Assessment of the U.S. Video Game Industry), $3.8 Billion (1984 Silicon Valley Fever)

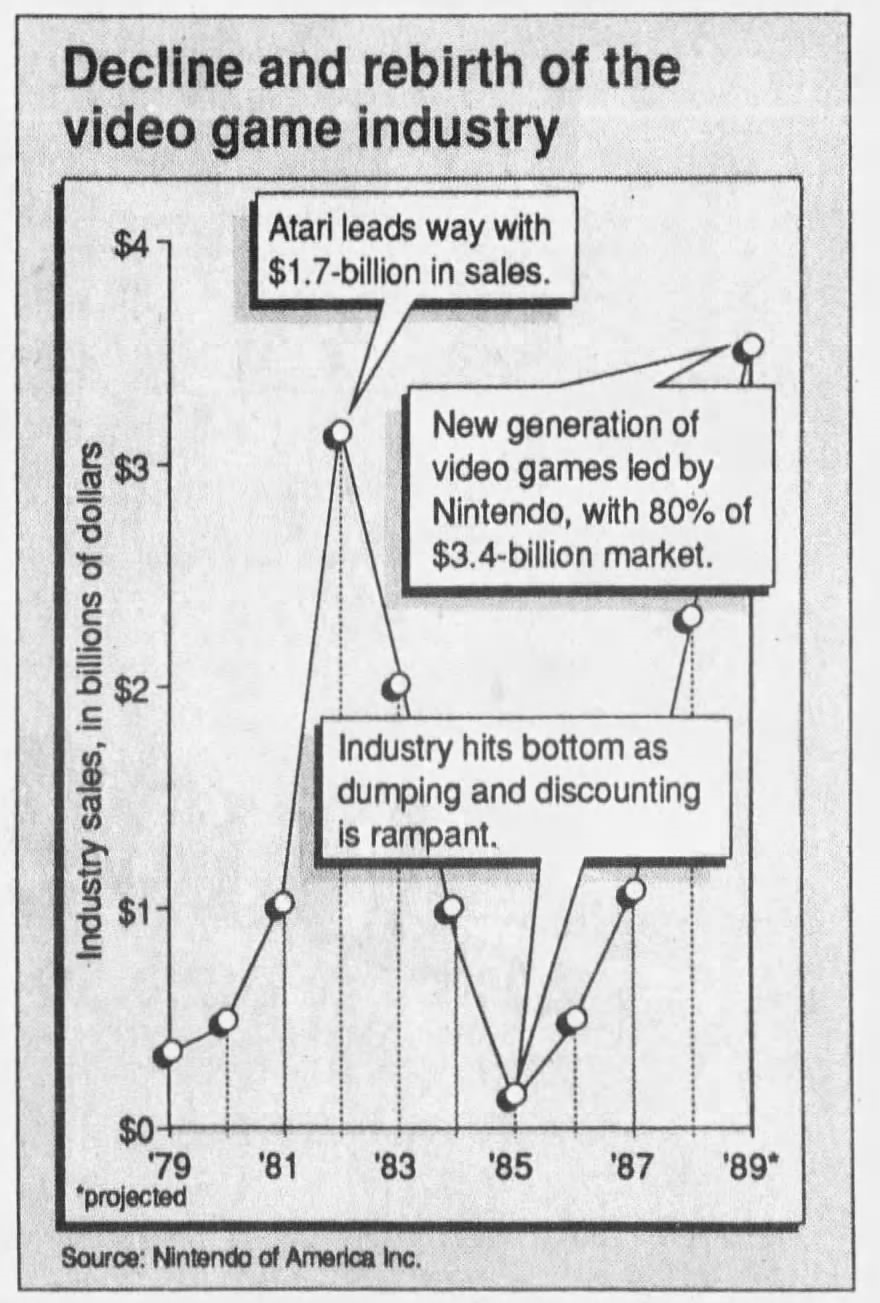
It’s all downhill from here, and we’ll see just how far it goes in a moment. Firstly though, we have the marvel as once again the market doubled, topped by Atari with 70-80% of the entire home video game market. They sat on top of sales of 8.2 million consoles which amounted to just about $1 billion at retail in hardware alone. Cartridges explode into a marvelous 60 million firm and eclipse the consoles in revenue by a narrower percentage than earlier years – the first sign of trouble.
There is a degree of variance in some of the reports that seem to be pointing more firmly towards a $3-4 billion dollar figure for the total market. However if you look at these, they tend to be from either the latter half of 1983 or in 1984. By that time there probably was a lot of incentive to look at the market with extra-tinted nostalgia, compounded by a few misguided reports that the market already hit $2 billion in 1981. It appears the retail revenue picture was $2-2.3 billion overall depending on the figures you think are most reliable.
Unfortunately, part of the consistency appears to conflate the figures, giving us no real indication of what wholesale was like in this time despite the supposed narrow gap provided. The beginnings of the North American Video Game Market Crash started with retailers dropping their orders in the latter half of 1982. The deep discounting was not on quite yet, but the manufacturers of video games across the spectrum were about to experience a shock proportional to their input to the market. There was no escaping the quicksand.

Console Units: 5.7 Million (1983-12 Software Strategies: The Home Computer and Videogame Marketplace), 6 Million (1984-02-05 Dayton Daily News pg 5-H), 6.6 Million (1984-01-10 St Louis Post-Dispatch pg 6C), 6.65 million (1984-09-20 Star Tribune pg 10B, 1985 Edition Electronic Market Data Book, 1985 Consumer Electronics Annual Review)
Console Revenue (Unspecified): $540 Million (1983-12 Software Strategies: The Home Computer and Videogame Marketplace)
Game Units: 75 Million cartridges (1983-12 Software Strategies: The Home Computer and Videogame Marketplace, 1984-01-10 St Louis Post-Dispatch pg 6C, 1985 Edition Electronic Market Data Book, 1985 Consumer Electronics Annual Review)
Game Revenue (Unspecified): $1.35 Billion in cartridges (1983-12 Software Strategies: The Home Computer and Videogame Marketplace)
Game Revenue (Wholesale): $1.4 billion in cartridges (1984-09-20 Star Tribune (Minneapolis) pg 10B, 1985 Edition Electronic Market Data Book)
Game/Console Revenue (Unspecified): $900 Million (1984-11-06 The Desert Sun pg A6) $1.9 Billion (1984-05-23 Philadelphia Daily News pg 41), $2.16 Billion (1988-04-05 Fort Worth Star-Telegram pg 3-1)
While at first these figures may look pretty okay for the video game industry, looking a bit closer shows that cracks are starting to show. There’s been a decline in console sales, reflecting how close the Atari VCS had come to hitting a majority of upper to middle class homes with televisions in the USA. The only console that was on the up was Colecovision. I’m inclined to believe the 6.65 million figure here and it does paint an even bleaker picture as the revenue fall is even greater, meaning the money being made on consoles was becoming much smaller despite the absence of large price reductions until 1984.
The real problem here is cartridges, who basically everyone reports at 75 or 76 million at the time. This seems like a positive rise, but looking at the revenue figure tells the real story. The rise has not reflected a precipitous uptick from the 60 million sold the previous year, but perhaps more importantly we are only getting the manufacturer’s numbers. While normally you’d expect the retail figure to be higher, it seems in this case it was very specifically not reported because the figure was especially scary.
Let’s put it this way: In a normal situation where a cartridge sells to consumers at $30, typically a wholesaler would be selling that cartridge to the retailer at $10. If instead because of oversaturation and the inability to sell new cartridges forces the retailer to sell that $30 cartridge at $10, that completely negates earnings. The overstock problem would deteriorate into sales of potentially $1.99 at the very bottom, meaning all the revenue was being scraped. It was getting bad for the retailers.
The overall market reports that the industry as a whole fell below a billion are likely doomsaying in retrospect, and they may have maintained near $2 billion. That was built on an uncomfortable foundation though, one where the people who would actually sell the games had no way to make money. That’s why you see companies going out of business precipitously in 1983, because they could not pay back the retailers for the stock they oversold into the market.

Console Units: 3 Million (1985 Edition Electronic Market Data Book, 1985 Consumer Electronics Annual Review)
Console Revenue (Wholesale): $165 million (1985 Edition Electronic Market Data Book, 1987-02-13 The Kansas City Times pg C-3)
Game Units: 54.5 Million cartridges (1985 Edition Electronic Market Data Book, 1985 Consumer Electronics Annual Review)
Game Revenue (Unspecified): $800 Million (1987-01-12 The Los Angeles Times pg IV-4, 1987-10-29 Chula Vista Star-News pg B-10)
Game Revenue (Wholesale): $765 million (1985 Edition Electronic Market Data Book)
Game/Console Revenue (Unspecified): $930 million (1988-04-05 Fort Worth Star-Telegram pg 3-1)
Only in 1984 are the cracks of the 1983 North American Home Video Game Crash really apparent. Once again we see a total abandonment of interest by analysts in a failing market, save for the Electronics Industry Association. What figures remain tell a bleak story. It’s a misunderstanding to say that the public lost interest in video games in this time period because they were bad, it’s pretty apparent here that the diminishing console sales was due to the fact that everyone in the income bracket with a desire to own a console already had one. They could get whatever games they wanted at this point at significant discount, whether they were good or bad.
The software sales are back towards their 1982 levels, but revenue even for manufacturers has taken a precipitous hit. Once again retailers don’t divulge how much they’ve been suffering and revenue means little if you aren’t making any money. Atari in this year would be bought by Jack Tramiel and future plans for console development were stalled by almost all players remaining in the field. The few remaining console companies were trying to dig themselves out of the deepest pit they could possibly imagine, and it hadn’t even reached its bottom.

Console Units: 1 Million (1986-12-22 Star Tribune (Minneapolis) pg 2C), 3 Million (1986-05-18 The Morning Call pg 18)
Game Units: 20 Million (1986-01-11 The Atlanta Constitution pg 2C)
Console/Game Revenue (Unspecified): $100 Million (1987-06-10 Chicago Tribune pg 5-2, 1988-11-20 The Boston Globe pg 64, 1989-07-30 Messenger-Inquirer pg 2F), $150 million (1988-04-05 Fort Worth Star-Telegram pg 3-1), $200 Million (1987-01-30 Detroit Free Press pg B1, 1987-11-27 The TimeS (Shreveport) pg 53), $500 Million (1990-09-16 The San Francisco Examiner pg D-4)
1985 is a legendarily desolate year in video game history. Coleco gets out, Atari Corp is too busy with the ST computer to pay any attention to the console market, and everybody either was severely hurt by the crash or saw no future in the market. All except Nintendo, who late in the year did manage to begin pushing their Nintendo Entertainment System in its rise to become even bigger than Atari.
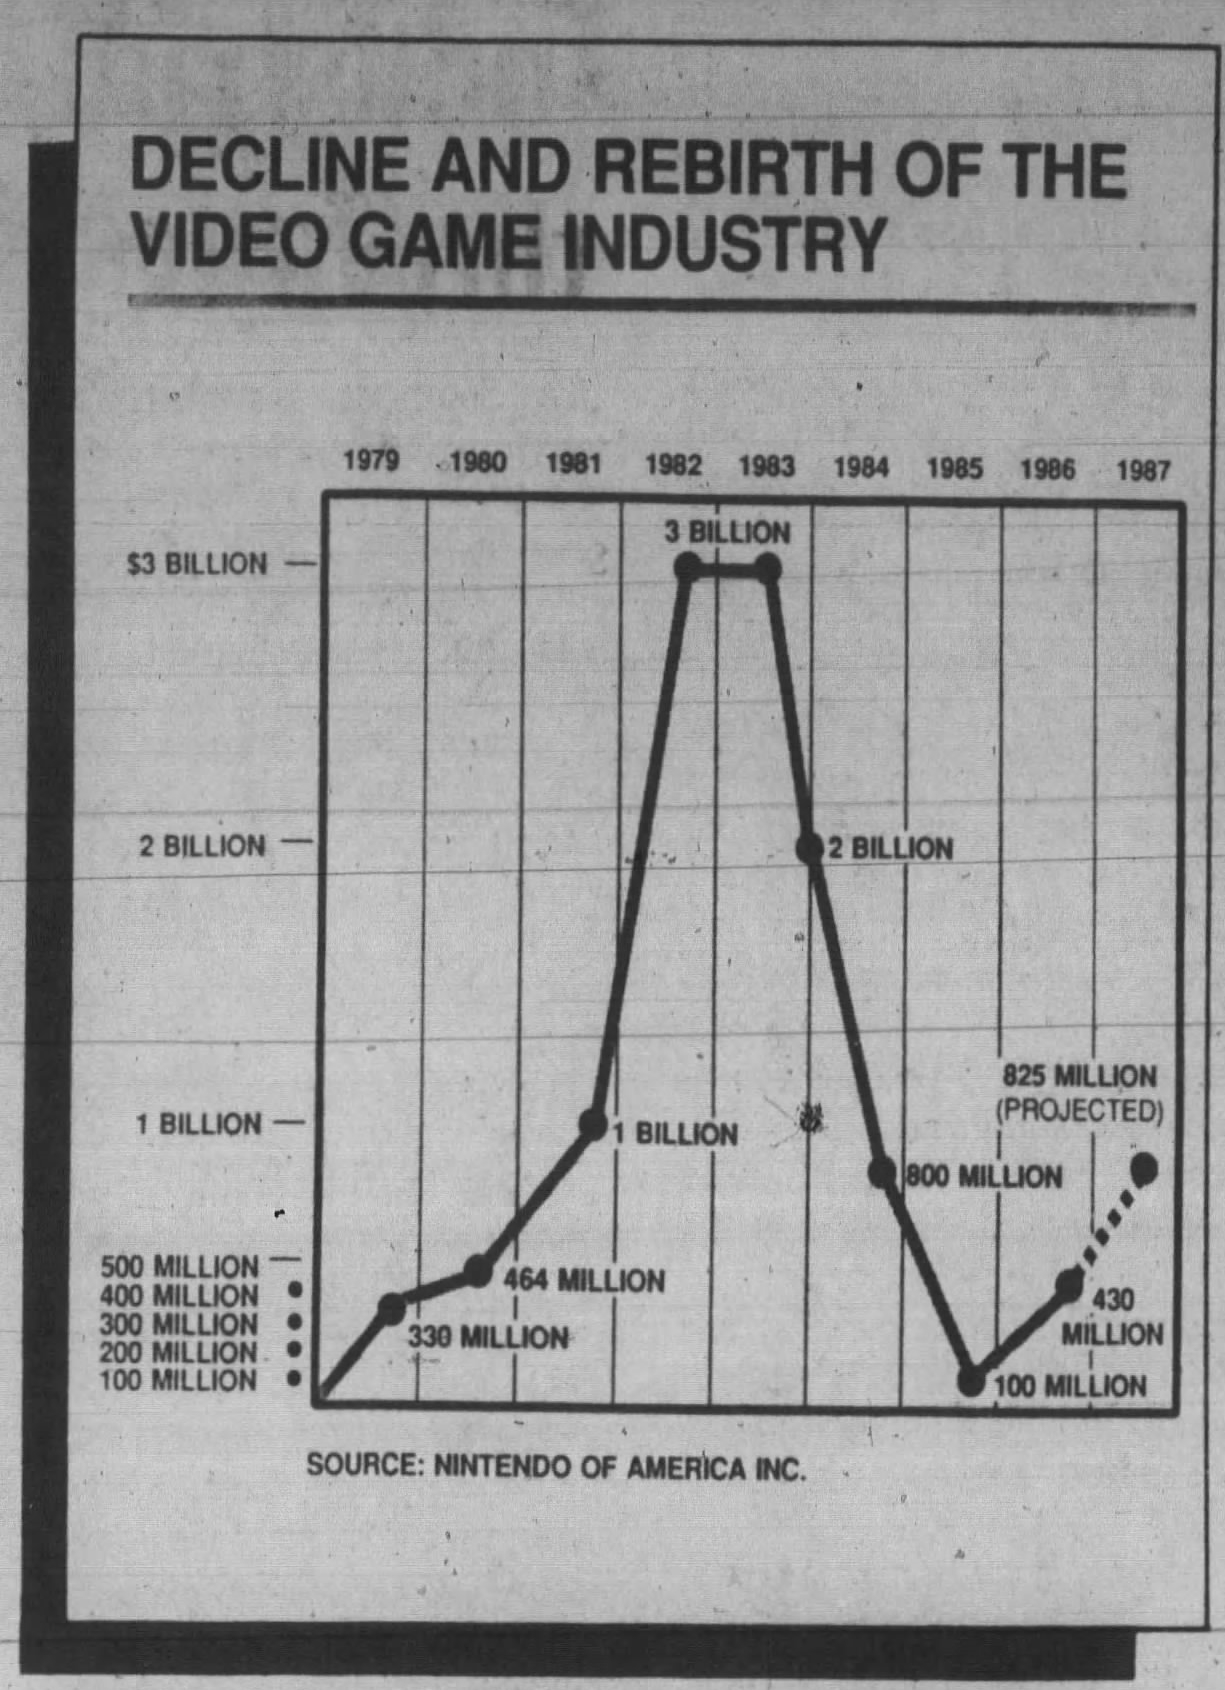
Exactly how far they had fallen is a matter of a little mythmaking. As noted by Alex Smith, $100 million for the total market was a number provided by Nintendo beginning in 1987 to show what they had brought the market back from. Many newspapers ran a chart Nintendo had created which featured this record low, which happens to be a nice round number to compare the size of the then current market against.
It was noted in 1986 and 1987 that analysts had deliberately stopped tracking the video game market because of the disaster it found itself in, though this may not have been strictly true. The 1986 Atlanta Constitution story prints projections they claim were from the Electronic Industry Association, but the EIA did not print these numbers in their 1986 industry reviews as they had completely stopped covering video games. However, the numbers provided seem to indicate that the predicted profit purely for cartridges in 1985 was $200 million from 20 million units. Still bad in greater market terms, but better than virtually nothing.
Game earnings could have virtually been anything given the building disaster from the prior years, so perhaps the closest we can get to the answer relies on how many consoles were actually sold. Again, the later estimates have such a wide gap that we’re in two different ballparks. Even Nintendo’s 50,000-90,000 console units was merely a drop in the bucket of the rest of the depressed industry.
Did the industry really bottom out at $100 million, or did it maintain a more even decline at more like $500 million? The higher figure doesn’t make total sense because it’s pretty clear that things went up the following year and none of those estimates quite hit that mark. I am inclined to believe it was more in the overall vicinity of $100-250 million, but we are lacking anything to steer us in the right direction. Let’s just say from the financial perspective: Video games were over.

Console Units: 1.4 Million (1990 Video Game: Past, Present and Future An Industry Overview), 2 Million (1987-02-13 The Kansas City Times pg C-3), 2 Million+ (1987-06-27 The Courier-Journal pg Scene-5)
Console Revenue (Wholesale): $220 million (1987-02-13 The Kansas City Times pg C-3)
Game Units: 8 Million cartridges (1987-02-13 The Kansas City Times pg C-3)
Console/Game Revenue (Unspecified): $200 Million (1987-01-30 Detroit Free Press pg B1), $400 Million (1991-01-20 Daily News pg 21), $430 Million (1987-06-10 Chicago Tribune pg 5-2, 1988-04-05 Fort Worth Star-Telegram pg 3-1, 1989-07-30 Messenger-Inquirer pg 2F)
Nintendo, Sega, and Atari made their presences known this year nationwide, but it was a slow reawakening for everybody. Retailers had cleared out their old stock enough and were hesitantly buying into consoles once more, doubling their output from last year and making over $200 million on new sales for the manufacturers with these more expensive models.
Now if we believe the figure from last year, it would look like cartridges are in a sharp decline, but more importantly the new software coming out would be sold at full price. How much did this amount to? Nintendo was insistent on the $430 million overall market figure with their take about $300 million of that. It may have been a bit lower, but it was reported on the very next year which at least puts it more in the path of a reasonable estimate. Were things back on track for video games?

Console Sales: 4.1 Million (1990 Video Game: Past, Present and Future An Industry Overview)
Game/Console Revenue (Unspecified): $900 million (1988-04-05 Fort Worth Star-Telegram pg 3-1), $1.1 Billion (1988-05-22 Asbury Park Press pg F6, 1988-06-25 The Courier-Journal pg 2, 1990 Video Game: Past, Present and Future An Industry Overview, 1991-01-20 Daily News pg 21)
1987 was the first of many consecutive Nintendo Christmases. Unfortunately the overall tracking became reliant on Nintendo’s estimates and they didn’t seem overly concerned with stating figures which included their competitors this time around. We’re left with a picture of a doubling console market and an absolutely explosive cartridge market. This checks out going by the reports of the time. The new 8-bit consoles were catching on and consumers were buying full-priced software in higher amounts than ever before.

Console Sales: 8 Million (1989-12-19 National Post Toronto, Canada pg 18, 1990 Video Game: Past, Present and Future An Industry Overview), 9 Million (1989-06-22 The Bulletin pg B-3)
Game Sales: 43 Million cartridges (1989-06-22 The Bulletin pg B-3, 1989-12-19 National Post Toronto, Canada pg 18, 1990 Video Game: Past, Present and Future An Industry Overview)
Console/Game Revenue (Wholesale): $1.89 Billion (1990-11-18 York Sunday News pg E2)
Console/Game Revenue (Unspecified): $2 Billion (1989-12-22 The Indianapolis News pg A-3), $2.3 Billion (1989-02-10 The Boston Globe pg 80, 1989-07-30 Messenger-Inquirer pg 2F, 1990 Edition Electronic Market Data Book, 1990 Video Game: Past, Present and Future An Industry Overview)
Analysts get their wake-up call right on the cusp of one of the most miraculous revivals in market history. In three years the dirty word of “video games” was being wiped away by a monumental advertising takeover by Nintendo. It’s easy to see how much that missing cartridge figure from last year hurts us when we go from 8 million to 43 million new cartridges sold. This is more than doubling which is what the hardware did, so which year was the more significant leap?
Individual revenue breakdowns are again not available but we have Nintendo’s figure as repeated by everyone at a pretty $2.3 Billion. The wholesale figure of $1.89 billion from 1990 is probably in error as there’s no way the take for retailers was that low, despite what some people have tried to claim about Nintendo not allowing retailers high margins. Stores were still making plenty of money on video games, and with competitors making up the 10-30% gap left by Nintendo everything looked bright for the future.

Console/Game Revenue (Wholesale): $2.43 Billion (1990-11-18 York Sunday News pg E2)
Combined Hardware/Software Sales (Unspecified): $3.4 Billion (1990 Edition Electronic Market Data Book, 1990-03-22 The San Francisco Examiner pg D-6, 1990 Video Game: Past, Present and Future An Industry Overview)
Nintendo Nation has been achieved with all eyes firmly open and focused on the new trend which firmly dominated the toy industry. Unfortunately it seems that everyone was eager to accept Nintendo’s market reports of the whole market without attempting to get a handle on what the rest of the market looked like. Overall Nintendo’s marketshare had kept growing, mainly at the expense of Atari, though Sega – through Tonka – did manage to put the Master System on the toy sales charts. The Genesis would premiere this year though and set the stage for a more exciting new decade.

Console Sales: 9 Million (1991-12-19 Kingsport Times-News pg 6C)
Console Revenue (Retail): $1.167 Billion (1996-07 The US And European Markets for Video Games and PC Entertainment Software)
Game Sales: 70 Million cartridges (1991-02 Replay pg 97)
Game Revenue (Retail): $3.158 Billion (1996-07 The US And European Markets for Video Games and PC Entertainment Software)
Combined Hardware/Software Sales (Unspecified): $4 Billion (1991-02 Replay pg 41, 1991-05-30 Chicago Tribune pg 1-20, 1991-11-26 Los Angeles Times, 1992-09-18 The Sacramento Bee pg Scene 3), $5 Billion (1991 Edition Electronic Market Data Book)
Combined Hardware/Software Sales (Retail): $3.7 Billion (1991-12-25 The Philadelphia Inquirer pg 8-C), $3.8 Billion (1991-12-24 Longview Daily News pg A11), $4.325 Billion (1996-07 The US And European Markets for Video Games and PC Entertainment Software)
The peak of the NES market has been reached with the Big N’s last year of utter, crushing domination. With the Super Famicom launching in Japan, they would ride out the final sole year of the NES with a firm grip on their surroundings. At least that’s what it seems like. In truth, the evidence appears to show that there wasn’t an increase for Nintendo over the prior year and the makeup was mainly from their competitors in Sega and NEC. Still, those sales numbers are nothing to sneeze at. This would have also been the first year of sales for CDs with the Turbografx addon, but nobody appears to have reported numbers on that.
The overall market figure varies along the spectrum of $4 Billion, with the $5 Billion figure probably based on early estimates. Hard to say which is more accurate, but what’s a few hundred million between friends? It was time for Nintendo to stop being the sole source reporting on these figures and the sole force dominating them, with the Console War about to begin.

Console Units: 7.285 Million (1996-07 The US And European Markets for Video Games and PC Entertainment Software)
Console Revenue (Retail): $1.365 Billion (1996-07 The US And European Markets for Video Games and PC Entertainment Software)
Game Units: 47.3 Million (1996-07 The US And European Markets for Video Games and PC Entertainment Software)
Game Revenue (Retail): $2.819 Billion (1996-07 The US And European Markets for Video Games and PC Entertainment Software)
Combined Hardware/Software Sales (Unspecified): $4.4 Billion (1992-12-08 Boston Globe), $5 Billion (1992-08 Replay pg 38), $6 Billion (1992-05-07 El Paso Times pg 10D)
Combined Hardware/Software Sales (Retail): $4 Billion (1992-09-18 The Sacramento Bee pg Scene 3)
These figures are a little bit limited, but part of the reason that the overall market took a backseat is because the reporting quickly became focused on the camps of Sega and Nintendo. This is an instance where looking at the individual reported revenue would be more telling, but we’re going to have to leave that to somebody else. In all it seems things were steadily growing, tracking to between $4.4-5 billion.
The 1996 report here is a little shaky and goes rather off the rails in its 1992 figures so I recommend to take it with some caution. In general it seems to report a market growth despite the reduction in unit sales. This is entirely normal for a console transition when things have once again become more expensive, leading to softer adoption of new software. As seen in the Atari market previously, a system that has been on sale for a long time means that more software is available for people to buy.

Game Units: 56 Million cartridges (1993-11-14 Chicago Tribune pg 18-4)
Game/Console Revenue (Unspecified): $4.5 Billion (1993-11-14 Chicago Tribune pg 18-4), $5.3 Billion (1993-01-17 The Spokesman-Review pg E3), $5.6 Billion (1994 Principles of Marketing)
With both Sega and Nintendo in full swing, there was a gentle growth as the companies fought for the new marketshare among audiences looking for something new in video games. The cartridge figure was climbing while the revenue tracked along with it, probably climbing to $5 billion or so. Nintendo was still riding high with well more than half the market, meaning that the conflict was still in its early stages.

Console Sales: Less than 10 Million (1994-12-05 The Baltimore Sun pg 11C)
Game Units: 73 Million (1994-11-20 The Tennessean pg 4F)
Game/Console Revenue (Unspecified): $4.5 Billion (1996-12-18 The Daily Item pg P8), $5 Billion (1996-12-09 The Los Angeles Times pg D2), $5.5 Billion (1994-03-04 Chicago Tribune pg 10), $6.5 Billion (1994-03-24 Lakeland Ledger pg 1E)
The Year of Sega has arrived! With the monumental marketing blitz of Welcome to the Next Level and the successful launch of Mortal Kombat by Acclaim, Sega was able to rip away Nintendo’s stranglehold for the briefest of moments in Holiday season of 1993. Cartridges saw a precipitous rise as there was finally a good reason to own more than one’s personal killer app for a console and the hardware sales were hearty.
As it seems to always be, the revenue picture is a problem. A span of $2 billion is not what you would call precise. Again tracking the prior year seems to point more towards the $5.5 Billion figure, though there was already starting to be concern about oversaturation. That will be more the subject for 1994.

Game/Console Revenue (Unspecified): $5 Billion (1995-04-16 Tampa Bay Times pg 1H, 1995-05-08 The Press Democrat pg D5, 1995-09-19 The Spokesman-Review pg D5)
Behind this boring figure, we have an interesting story to tell. In the midst of the successful 16-bit market, there was the arrival of the next generation platforms. These include the PlayStation and the Saturn but also the 3DO and the Atari Jaguar. While alsorans in memory today, this created significant confusion in the market as retailers, consumers, and the competing companies were totally flustered on what to do.
On the consumer end, this led to hesitation to buy significantly more games from the prior year when everything was new and exciting. For retailers, they started paying more attention to multimedia/CD-ROM devices which were coming down the pipeline which promised to make video game consoles obsolete. Then the game creators were tripping over themselves to entice the spending they had seen in recent years, leading to missteps like the Sega 32X to try and sustain a moribund market.
This slight decline is hiding a greater issue which will poke its head above the surface in 1995. Alex Smith covers more of the details around this period in an episode of his podcast They Create Worlds, The Crash that Almost Was. Not many people know that things almost became a disaster before the PlayStation provided a way back up.

Console Units: 3.4 Million (1998 Key Trends in the Video Game Industry)
Console Revenue (Unspecified): $513 Million (1998 Key Trends in the Video Game Industry)
Game Units: 24.5 Million (1998 Key Trends in the Video Game Industry)
Game Revenue (Unspecified): $1.023 Billion (1998 Key Trends in the Video Game Industry)
Game/Console Revenue (Unspecified): $3 Billion (The Los Angeles Times pg D2), $3.1 Billion (1996-12-18 The Daily Item pg P8), $3.2 Billion (1999-03-26 Hattiesburg American pg 6B), $3.3 Billion (1996-06 Replay pg 74)
In this year we finally get formal tracking by the NPD group, who continue to run reasonably reliable estimates to this day. Their figures, though, are not telling a particularly happy story. New console sales had collapsed from two years ago and game sales – for the first time majorly including CD-ROM – was not looking much better. Even the PlayStation was not an immediate hit and it was during this time that the less notable consoles like the Jaguar and 3DO completely fell off in the flagging marketplace.
With the consistency of the total market being $3 billion, it’s likely that the unspecified revenue from NPD in this instance was wholesale, which is always nice to sort out. Not to belabor the point, but the overcrowding of consoles and software was creating a potential for another serious problem in the video game market. The rebound had to happen soon.

Console Units: 5.2 Million (1998 Key Trends in the Video Game Industry)
Console Revenue (Unspecified): $909 Million (1998 Key Trends in the Video Game Industry)
Game Units: 27.8 Million (1998 Key Trends in the Video Game Industry), 49.5 Million (1997-03-03 The San Francisco Examiner pg B-3), 50 Million (1997-07-20 The Atlanta Constitution pg H1), ~51.38 Million (1997-06-19 Interactive Entertainment Software Review)
Game Revenue (Unspecified): $1.155 Billion (1998 Key Trends in the Video Game Industry)
Game Revenue (Retail): $2 Billion (1997-05-27 Chicago Tribune pg 3-2, 1997-07-20 The Atlanta Constitution pg H1), ~$2.0075 Billion (1997-06-19 Interactive Entertainment Software Review)
Game/Console Revenue (Wholesale): $3.059 Billion (1997-12-04 The Danville News pg 15)
Game/Console Revenue (Unspecified): $3.65 Billion (1998 Video game sales hit new highs in 1997), $3.7 Billion (1997-06-30 Arizona Daily Star pg D8, 1997-10-14 Austin America-Statesman pg D8, 1999-03-26 Hattiesburg American pg 6B), $3.8 Billion (1999-07-28 Chicago Tribune pg 3-1)
As possibly unsatisfying as it is to admit, it was Nintendo’s entry that really rebounded the market. For all its flaws, the N64 was more familiar to retailers and was cheaper than the competition for consumers. In the first two years, the N64 outpaced the PlayStation in the US and made the market grow again. In the end, Sony would have more enticing offerings for a broader audience though.
The software estimates here have a curious gap from the assumptions the following year and the 1998 study. It’s possible the 1998 figure was only tracking cartridges, and assuming the figure of around 50 million does not massively throw off the revenue picture. I’m sure plenty of people will recall how expensive N64 games were and certainly Nintendo was making a nice profit.
Assuming around $1 billion for consoles and $2 billion for software wholesale value adds up nicely, but the question then is, would the retail figure be less than a billion over that? Again we’re in a slightly shaky period where it’s possible there was still a large amount of discounted product. Sony was also not as aggressively pushing high margins on software or hardware, though they were at least making money on software. We’ll have to assume a $3.7 billion retail figure for now.

Console Units: 8.4 Million (1998 Key Trends in the Video Game Industry)
Console Revenue (Unspecified): $1.214 Billion (1998 Key Trends in the Video Game Industry)
Game Units: 45 Million (1998 Key Trends in the Video Game Industry), 48 Million (1998-01-27 The Cincinnati Enquirer pg B7)
Game Revenue (Unspecified): $1.87 Billion (1998 Key Trends in the Video Game Industry), $2.24 Billion (1998-07-28 Daily Record (Morristown) pg E6)
Game/Console Revenue (Unspecified): $4.4 Billion (1999-03-26 Hattiesburg American pg 6B), $5.1 Billion (1998-03-16 The Los Angeles Times pg D3), $5.5 Billion (1998 Video game sales hit new highs in 1997, 1998-01-27 The Cincinnati Enquirer pg B7)
Console Revenue (Retail): $3.99 Billion (1998-12-05 Tampa Bay Times pg 7E), $5.004 Billion (2002 Rivalry in Video Games), $5.5 Billion (1998-02-10 The Sydney Morning Herald pg 26)
The games industry is now in its ascent which has largely continued unabated up to the present day, with the bumps you should expect from having read this chart. Consoles experienced a significant rise in adoption though curiously it looks like game sales fell. This may be surprising for those who remember their shelves crowded with million selling PlayStation games, but in 1997 the N64 was still top of the software charts. It would fall off a cliff after this though as the steady software release schedule became non-existent.
The unspecified revenues for console and games appear to both be wholesale, as does the $3.99 billion figure which is erroneously stated as retail. In all, the retail market appears to have come back from its decline starting in 1994 back to a healthy $5.5 billion. Markets change but the video game industry was remaining steady now that its support structures had been properly built.

Console Units: 9.2 Million (1999-05-14 Star Tribune (Minneapolis) pg D1)
Console Revenue (Unspecified): $3.4 Billion (1999-05-14 Star Tribune (Minneapolis) pg D1)
Game/Console Revenue (Unspecified): $3.6 Billion (1999-08-01 The San Francisco Examiner pg B-5), $5.5 Billion (1999-03-26 Hattiesburg American pg 6B), $6.2 Billion (1999-07-28 Chicago Tribune pg 3-1), $6.3 Billion (1999-01-25 NPD Reports The U.S. Video Game Industry, 1999-09-08 The Gazette (Montreal) pg D1)
Game/Console Revenue (Retail): $5.541 Billion (2002 Rivalry in Video Games)
With the N64 on the decline and the Sega Saturn being discontinued, Sony had reign of the market and would hold that leash for another 8 years. The US was reaching 10 million console units sold per year, though unfortunately we’re lacking a good picture on software adoption. By this point it appears the retailers had stopped reporting their direct numbers to NPD who – once upon a time – were noting the top ten software titles every year with exact figures. The relationship with tracking groups from this point on would always be shaky.
Another wide gap of overall market revenue exists, but again trusting in NPD we land at a figure of about $6 billion with possibly more than half of that purely coming from consoles, which seems a bit odd. This was the highest revenue that the industry had ever reached and sparked a new confidence in video games as their own industry. Past 2000, video games were rarely ever referred to as a subsection of the toy industry which they had been to that point. It was a new dawn for this exciting product category and things were only going to get better.

Game/Console Revenue (Unspecified): $6.1 Billion (2000-04-19 Chicago Tribune pg 2-2), $6.9 Billion (2000-07-21 The Boston Globe pg C7, 2001-01-17 NPD REPORTS U.S. VIDEO GAME INDUSTRY), ~$7 Billion (2000-02-27 The Los Angeles Times pg B1)
Game/Console Revenue (Retail): $5.999 Billion (2002 Rivalry in Video Games)
In this final look at console sales we have to end on an unfortunately shallow picture of the industry, but we can take a moment to reflect on the journey. From a single company generating a few million dollars off of 69,000 systems to $6.9 billion in a diversified industry of thousands of companies and millions of players.
I’m hoping that this list (and the others below) will serve as a much stronger foundation for research than the few resources that have existed previously. Knowing when things were growing versus contracting is important to many different stories whether they are player-focused, business-focused, or any other story worth telling. However, we’re not done with the story yet. Next we will have a look at what sort of story is told when looking at the figures for the arcade.
Arcades/Coin-Op

Coin-op Video Game, New Units Purchased: 48,000 units (1973-11-10 Cash Box), 50,000 (1974-06-27 Electronics), 70,000 (1976-06 The Coin Operated and Home Electronic Games Market)
Coin-op Video Game Revenue: $20 Million (1974-06-27 Electronics), $77 Million (1976-06 The Coin Operated and Home Electronic Games Market)
Ping and a Pong, everywhere a ping-pong! The first year of the video game market was saturated with ball-and-paddle of every type and sales by manufacturers were fairly strong. One thing to note about the difference of numbers between arcade and console sales is that these expensive machines were never meant to sell in the millions. While markets would shift, there’s no expectation that an arcade cabinet would sell a million units because more than one person is meant to play the machine at a location.
We have a pretty significant gap for our first estimate. Admittedly the Cash Box figure had not yet reached the end of the year, but given that it’s an inside industry source I felt it was worth noting. Could they market have increased by 20,000 units in a month? Possibly. Many of the Pong clone manufacturers didn’t enter the market until later in the year, and after the MOA show in early November there was potential for more orders. However, operators didn’t tend to buy new machines for the Winter when people weren’t generally out visiting locations. I would put this more in the 60,000 range if we are to take the numbers as we’re given them.
A note on the other figure “revenue”, when we talk about revenue in arcade terms this would normally mean money going to the manufacturers. Perhaps the more important figure for coin-operated games is ‘coin drop’, AKA how much money is being put into machines for operators to collect. That tends to be referred to as ‘income’ and was not tracked until later. In this case I would believe the higher figure because the lower one seems to presume that arcade cabinets sold for much less than they actually did.

Coin-op Video Game, New Units Purchased: 40,000 [30,000 in upright, 10,000 in cocktail] (1976-06 The Coin Operated and Home Electronic Games Market)
Coin-op Video Game Revenue: $40.5 Million [$33 Million in upright, $7.5 Million in cocktail] (1976-06 The Coin Operated and Home Electronic Games Market)
Things got a bit tumultuous in 1974. With companies who had never been in the coin-op market before flooding in to get a peace of the new category, oversaturation was quickly achieved and the newness of the Pong-type game took less than a year to fade out. At least, this is how it was in traditional markets. 1974 also saw the introduction of a new category called the cocktail cabinet, a table-style arcade game that was meant to fit in with fancy lounge culture. This was a new audience for the game and was thus counted as a separate category.
Unit sales may have nearly halved depending on if you believe the report from the prior year, coupled with a similar revenue picture. The indication from the 1976 report appears to imply also that arcade cabinets were selling for less than their usual take, with cocktail cabinets selling for less than the standard cabinet which also appears to track. In all, not a great year for the category despite some valuable games emerging.

Coin-op Video Game, New Units Purchased: 39,000 (1983 Semiconductor Industry Service Vol 1), 50,000 (1976-06-06 The San Francisco Examiner), 54,000 (1977-01 Appliance Manufacturer), 68,000 (1977-01 Appliance Manufacturer), 79,000 [53,000 in upright, 26,000 in cocktail] (1976-06 The Coin Operated and Home Electronic Games Market)
Coin-op Video Game Revenue: $59 Million (1983 Semiconductor Industry Service Vol 1), $68 Million (1977-01 Appliance Manufacturer), $76 Million [$58 million in upright, $18 million in cocktail] (1976-06 The Coin Operated and Home Electronic Games Market)
1975 sees a rise up from the previous year, but the question of how much of a gain is up in the air. The number of games sold-gap is up to double, even including one publication with two completely contradictory numbers in the same month. While always tempting to say the middle road is the best road, the recovery of Atari this year with games like Tank and Jet Fighter could have given the industry a boost. It’s also pretty clear that cocktail cabinets grew in this year, though they stalled out before the end of it. The 1976 report appears to have its finger on the pulse, if slightly exaggerating based on early forecasts.
Extrapolating from this to a lower revenue figure is tricky, but again after this year the cocktail market was pretty much done for (though some games would continue to be made in cocktail versions). $70 million feels about right for where things ended up.

Coin-op Video Game, New Units Purchased: 50,000 (1982-12 Video Game Industry: Strategic Research)
Overall Coin-op Video Games on Location: 173,700 video games (1981-07 Vending Times Census of the Industry), 175,000 video games (1983-02 The Electronic Games Market in the US)
Coin-op Video Game Revenue: $75 million (1982-12 Video Game Industry: Strategic Research), $95 Million (1979-03 Home & Coin Operated Electronic Games)
Coin-op Video Game Income: $334,190,000 (1981-07 Vending Times Census of the Industry), $365 Million (1983-02 The Electronic Games Market in the US)

What happened to 1976? Quite simply, it wasn’t reported. Ironically, it may have been a much better year than 1977 turned out being. Standout releases from Midway like Gun Fight and Sea Wolf along with Atari’s Breakout all stood out far more than anything released in the heart of 1977. The big hit of that year, Space Wars, was only released at the very tail end and did not even have as high of a unit sales as a Sea Wolf.
There was another threat to the video game dominance that had reached its zenith in 1977: Pinball. Solid-state technology now had hit across the industry and combined with popular licenses was going to set the tone for pinball for the rest of time. While we’re not diving into overall industry figures here and now, it’s clear to see that pinball was the hot game for the period of 1975-1978.
In this year we also are provided with our first look at the income to operators. Video games would gain – and maintain – a reputation as the highest earners of any arcade piece. They came with complications, but they could yield high rewards for a strategic operator who didn’t bet on a loser. It was between 4 and 5 times what the manufacturers received in this period, depending on which figure you believe.

Coin-op Video Game, New Units Purchased: 24,000 (1984 A Competitive Assessment of the U.S. Video Game Industry), 62,000 (1979-03 Home & Coin Operated Electronic Games), 70,000 (1982-12 Video Game Industry: Strategic Research)
Overall Coin-op Video Games on Location: 164,600 video games (1981-07 Vending Times Census of the Industry), 165,000 video games (1983-02 The Electronic Games Market in the US)
Coin-Op Video Game Revenue: $80 Million (1979-03 Home & Coin Operated Electronic Games), $110.2 million (1982-12 Video Game Industry: Strategic Research, Strategic Analysis)
Coin-op Video Game Income: $308 Million (1981-07 Vending Times Census of the Industry), $380 Million (1983-02 The Electronic Games Market in the US)
It was the year of Space Invaders, but in both its home country of Japan and in the US this fact took a while to hit. 1978 would be supported with the aforementioned Space Wars, Star Fire, and Starship 1, a clear reflection of the Star Wars craze. Even this fervor for space-themed action games was not by itself enough to float the industry from a barely increasing number of units, probably most accurately the 62,000 figure.
Nor did the intake increase very much at all. There had to be more to video games than novelty to capture the attention, to take cues from the rising star of computer-driven pinball to bring video games to new heights. Again, it’s hard to stress enough just how important Space Invaders was to this moment just as it was for the console industry. We were about to see a tidal change in the market.

Coin-op Video Game, New Units Purchased: 106,700 (1982-12 Video Game Industry: Strategic Research)
Overall Coin-op Video Games on Location: 230,000 video games (1983-02 The Electronic Games Market in the US), 232,800 video games (1981-07 Vending Times Census of the Industry)
Coin-Op Video Game Revenue: $177.1 million (1982-12 Video Game Industry: Strategic Research)
Coin-op Video Game Income: $910 Million (1983-02 The Electronic Games Market in the US), $968.3 Million (1981-07 Vending Times Census of the Industry)
See? With only a year, the industry had rebounded and was on its first booming rise towards an unforeseen skyward limit. The unit sales nearly doubled and the money coming in did even more than that. Production runs went from low thousands to up to tens of thousands in the course of a few months, Space Invaders being a tide that buoyed the rest of the industry.
Of course this did come at the expense of pinball, which while never in danger of going away did enter a period of decline for the next few years. Pinball and video games sort of traded off market share for a long time, meaning that interest in one came at the cost of interest to the other. They would learn much from each other though, meaning that the next time pinball rises it will have become more video game-like.
The biggest figure difference is in income. While not nearly as bad as some other years, a $50 million difference does beg the question. In this case it appears the Vending Times was closer to the root of the estimates so we’ll air on the side of the higher figure.

Coin-op Video Game, New Units Purchased: 150,000 (1984 A Competitive Assessment of the U.S. Video Game Industry), 232,000 (1982-12 Video Game Industry: Strategic Research), 340,000 (1983-02 The Electronic Games Market in the US)
Overall Coin-op Video Games on Location: 500,000 video games (1981-12-17 Rapid City Journal pg 20), 510,000 video games (1983-02 The Electronic Games Market in the US), 540,000 video games (1980-11-15 Play Meter), 540,600 video games (1981-07 Vending Times Census of the Industry), 579,750 video games (1982-12 Video Game Industry: Strategic Research)
Coin-op Video Game Income: $2.65 Billion (1983-02 The Electronic Games Market in the US), $2.8 Billion (1981-12-17 Rapid City Journal pg 20), $2,811,122,000 (1981-07 Vending Times Census of the Industry)
Coin-Op Video Game Revenue: $432.3 million (1982-12 Video Game Industry: Strategic Research), $520 Million (1982-03-18 Kenosha News pg 31, 1983-02 The Electronic Games Market in the US)
Things are getting crazy! The arcade industry is in its upswing with seemingly no end in sight. Starting the year with Asteroids, ending with hits like Defender, there’s no wonder we’re launching into levels not seen in the coin-op industry for a long while. At first we do have to contend with the mess of the unit sales, but by subtracting the overall unit sales from the 1981 Vending Times report, we get a figure of 307,800. This does not necessarily account for operators who were buying new games to replace their old ones, but it sets a lower limit on how many games would have been purchased.
It should also be noted that the Play Meter figures report on an August to July cycle, meaning that they don’t report the entire year in question. Sometimes it’s rather close to the related figures, but it can get rather off so treat that one with caution. It is rather useful as a metric for what was purchased in the peak buying season of that year but doesn’t reflect what may have happened afterwards.
Income solely for video games was at $2.8 billion in an industry of over $7 billion. Video finally eclipsed pinball by a fairly high margin, bringing in a take of about half a billion for the manufacturers. Over half a million video games were now on location, breaching into unseen realms of the coin-op industry and proliferating in the new style of arcade that grew up with the video game era. This was the heart of the Golden Age of Video Games.

Coin-op Video Game, New Units Purchased: 342,000 (1984 A Competitive Assessment of the U.S. Video Game Industry), 400,000 (1981-11-15 Play Meter), 470,000 (1982-02-08 Green Bay Press-Gazette pg A-4, 1983-02 The Electronic Games Market in the US), 486,300 (1982-12 Video Game Industry: Strategic Research)
Overall Coin-op Video Games on Location: 780,000 video games (1981-11-15 Play Meter), 850,000 video games (1983-02 The Electronic Games Market in the US), 980,000 video games (1982-12 Video Game Industry: Strategic Research), 1,100,000 video games (1982-07 Vending Times Census of the Industry)
Coin-Op Video Game Revenue: $750 Million (1983-02 The Electronic Games Market in the US), $900 Million (1982-03-18 Kenosha News pg 31) $978.8 Million (1982-12 Video Game Industry: Strategic Research)
Coin-op Video Game Income: $4.862 Billion (1982-07 Vending Times Census of the Industry), $5 Billion (1982-01-28 Des Moines Tribunes pg 9D), $5.525 Billion (1983-02 The Electronic Games Market in the US), $5.7 Billion (1981-11-15 Play Meter, 1982-02-08 Green Bay Press-Gazette pg A-4)

We’re stratospheric now! Without a doubt, the happy times for the arcade industry came in 1981. There were beginning to be cracks such as games not being hot-earners for as long, but with hits like Pac-Man, Donkey Kong, and Scramble, who needed longevity? Again using the Vending Times overall units as a metric, we get a minimum between the mid and high end at 439,400 units. It’s clear to see by now that the 1984 report lowballed everything.
Revenue starts to have a fairly wide gap, probably because the number of important manufacturers was ballooning which made gathering numbers more difficult. It was probably at least $900 million, which pairs nicely with a figure of nearly $5 billion for intake by the operators. This meant that video games were over half of the amusement industry’s income for this year, which sat between $8.2-9 billion. There was no further question for video games as a mainstay.

Coin-op Video Game, New Units Purchased: 355,000 (1984 A Competitive Assessment of the U.S. Video Game Industry), 560,000 (1983-02 The Electronic Games Market in the US), 640,000 (Play Meter)
Coin-Op Video Game Revenue: $930 Million (1983-02 The Electronic Games Market in the US)
Coin-op Video Game Income: $4.363 Billion (1983-07 Vending Times Census of the Industry), $6.95 Billion (1983-02 The Electronic Games Market in the US), $7.7 billion in video games (1982-11-15 Play Meter)
Overall Coin-op Video Games on Location: 1,198,950 video games (1982-12 Video Game Industry: Strategic Research), 1.2 million video games (1983-07 Vending Times Census of the Industry), 1.285 million video games (1983-02 The Electronic Games Market in the US), 1.375 million video games (1982-11-15 Play Meter), [1.4 million video games] (1983-03-29 Public Opinion pg 15)
Now hold on a second… Something doesn’t look right.
Indeed, looking at the income and overall games picture one can quickly tell that something had gone very pear-shaped. Looking at the Vending Times picture of overall games on location, it appears that only 100,000 new games were sold but this is a bit misleading. Games would often go into retirement (I.E destroyed) because of space reasons, so the old 70s models would be cycled out.
Again, the Play Meter figures do not go through the whole year and better reflect the peak buying season in 1981. It’s very difficult to tell what number of new video game purchases might be more reliable, but it does appear that a slump in the industry is building with the video game share becoming lessened.
What was going on? Here we were in the middle of a market crash, but not the same market crash which torpedoed the Atari market. The 1982 North American Arcade Market Crash was set in motion by a completely different set of factors, namely by a huge amount of new operators entering the scene. These new operators would place so many games on location that their markets became saturated, and with video games earning big for only a few months at a time as new products came down the line, it made it so that operators were reluctant to purchase new games.
Earnings remained high, but they were confined to old games which lost their luster and would in the following year become completely anathema to the hardcore players. The earnings fall across a wide spectrum again but maybe were closer to $6 billion than Vending Times’ estimates which would reflect a completely static market. Things did clearly grow, but there was a stalling out because of gradually falling interest.
Outwardly, things remained in the arcade’s favor with a major cultural impact reaching its zenith in 1982. In terms of its future business prospects though, there was a lot of justified worry in the coin-op industry.

Coin-op Video Game, New Units Purchased: 301,503 (1983-11-01 Play Meter)
Overall Coin-op Video Games on Location: 1,150,000 video games (1984-07 Vending Times Census of the Industry), 1,491,359 video games (1983-11-01 Play Meter)
Coin-Op Video Game Income: $2.9 Billion (1984-07 Vending Times Census of the Industry)
The number of new purchased units appears to be in decline, but in 1983 we have a new category that may have had some trouble being tracked: Kit games. Converting your video game from one game to another became a new way to revitalize stale games on location. Say you have a Pac-Man cabinet that is no longer making money, Universal USA – who first became successful with this concept – would provide you the pieces to change the cabinet into a Mr. Do game like a new control panel and marquee. There was a new game in town!
This appears to have helped video game income stay afloat, even as the rest of the industry suffered in a fall of several billion dollars in overall take. Once again video games remained on top of the earnings but suffered perhaps a 50% reduction in the course of the year. General video games on location have two different trajectories in the trades, but Play Meter seems to have been more comprehensive, even if – again – it doesn’t track to the end of this year. The slight rise buoyed by confidence in kits meant that things were going to recover despite the scary downturn.

Coin-op Video Game, New Units Purchased: 168,508 [149,581 video games, 18,927 laserdisc games] (1984-11-01 Play Meter)
Overall Coin-op Video Games on Location: 1,001,600 video games (1985-07 Vending Times Census of the Industry), 1,095,361 video games [1,068,532 uprights/kits, 26,829 laserdisc games] (1984-11-01 Play Meter)
Coin-Op Video Game Income: $2.5 Billion (1984-07 Vending Times Census of the Industry)
A new savior appeared in 1983 that rippled rather limply into the following year: Laserdisc. Inaugurated by the decent success of Dragon’s Lair, you can see that even after most of the laserdisc games had been made it resulted in not very many sales, but enough for the industry to optimistically hope a new category had been created. New video game sales came back down to 1980 numbers as pinball and redemption started to suck the oxygen out of the room.
This also resulted in the decline in the units on location. Now, considering that thirteen years ago there were no video games on location this is pretty good, but the kits were a patch primarily focused on street locations. As the number of dedicated arcade spaces lessened, so too would the overall games on location as they sought a more healthy equilibrium. Would they succeed?

Overall Coin-op Video Games on Location: 920,000 video games (1986-07 Vending Times Census of the Industry)
Coin-Op Video Game Income: $2.35 Billion (1986-07 Vending Times Census of the Industry)
Once again we have a conundrum of falling profits leading to a lack of financial investigative interest in the market until 1988. It appears that a precipitous fall in video interest struck the industry, which would soon be overtaken by pinball. The revival of Williams in particular would signal a rise in pinball that would persist through the remainder of the 1980s, signaling a year in which the electronic screen-based games were cycled out for more novel offerings. However, income for games did not fall nearly as hard as the number of games on location, indicating good signs of stability. Play Meter called this year the emergence from the shakeout, which is definitely apparent when looking at the number of locations.

Coin-op Video Game, New Units Purchased: 173,000 (1988 Play Meter Directory)
Overall Games on Location: ~945,400 video games (1988 Play Meter Directory)
This year was fairly stagnant, but there was reason to be hopeful about the prospects of video games again. Tracking resumes on the new units which matches fairly well with the figures from 1984, showing that the between-year was probably a decline or totally unchanging. This does, though, lead to a wider adoption of video games. A note on sources, we no longer have to worry about Play Meter’s dating system because they shifted their Directories to the end of the year in 1988, though they used percentages for the earlier years which results in a slightly more hazy estimate. Regardless, this was right on the edge of another exciting period in arcade video games.

Coin-op Video Game, New Units Purchased: 225,000 (1988 Play Meter Directory)
Overall Coin-op Video Games on Location: [~1,087,200 video games] (1988 Play Meter Directory)

The magical million mark is once again broken as a huge portion of the new video games purchased were not to replace the old, but set up as new money earners. 1987 was the year of Double Dragon, which solidified a new approach of drop-in-drop-out co-op that had been pioneered by Gauntlet. Another one of those seminal arcade games, Double Dragon helped sustain interest in locations that could only house a handful of games because of its simplicity and ability to support simultaneous play.
Other exciting offerings brought up the purchasing a bit as well. Operation Wolf by Taito reinvigorated the demand for light guns, After Burner by Sega was not the flashiest taikan cabinet but more accessible to most locations, and even the somewhat forgotten Roadblasters by Atari were all solid hits in this time period. Ultimately it would be a future that brought multiplayer back to the forefront of the arcade which would be paired with a comfortable rise in profit worth reporting on.

Coin-op Video Game, New Units Purchased: 243,000 [153,000 dedicated, 90,000 kits] (1988 Play Meter Directory)
Overall Games on Location: ~1,115,000 video games (1988 Play Meter Directory)
A banner year for coin-op, 1988 would be the second highest purchasing year for video games post-Crash. It was the heart of the beat-em-up phase in arcades with the likes of Splatterhouse, Altered Beast, and more lighting up the charts with newly minted 32-bit hardware screaming onto the scene. This is also the first year we get a charting for individual kit sales, though they have been with us since 1983, nestled inside the overall figures. At the moment, the cabinet sales eclipsed purchases of kits possibly because of the very new types of machines which were coming in. The next year, in 1989, this would flip and remain relatively stable since.

Coin-op Video Game New Units Purchased: 210,000 [80,000 dedicated video games, 130,000 kit video games] (1990 Play Meter Directory)
Overall Coin-op Video Games on Location: 1.2 million video games (1990 Play Meter Directory)
The biggest change of note in the market was the adoption of kit games outpacing dedicated sales, which would remain mostly true for the remainder of the time we’ll be looking at. This could be due to low adoption of games after this period for a myriad of reasons leading purely to renovations of old cabinets or a much delayed replacement of old Pac-Man cabinets in the corner. Either way the category was continuing to grow and with the promise of new and exciting things in the 1990s. There were still locations to be filled and this new dawn of the arcade video game was looking bright.

Coin-op Video Game, New Units Purchased: 184,000 units [77,000 dedicated video games, 106,000 kit video games] (1991 Play Meter Directory)
Overall Games on Location: 1 million+ video games (1991 Play Meter Directory)
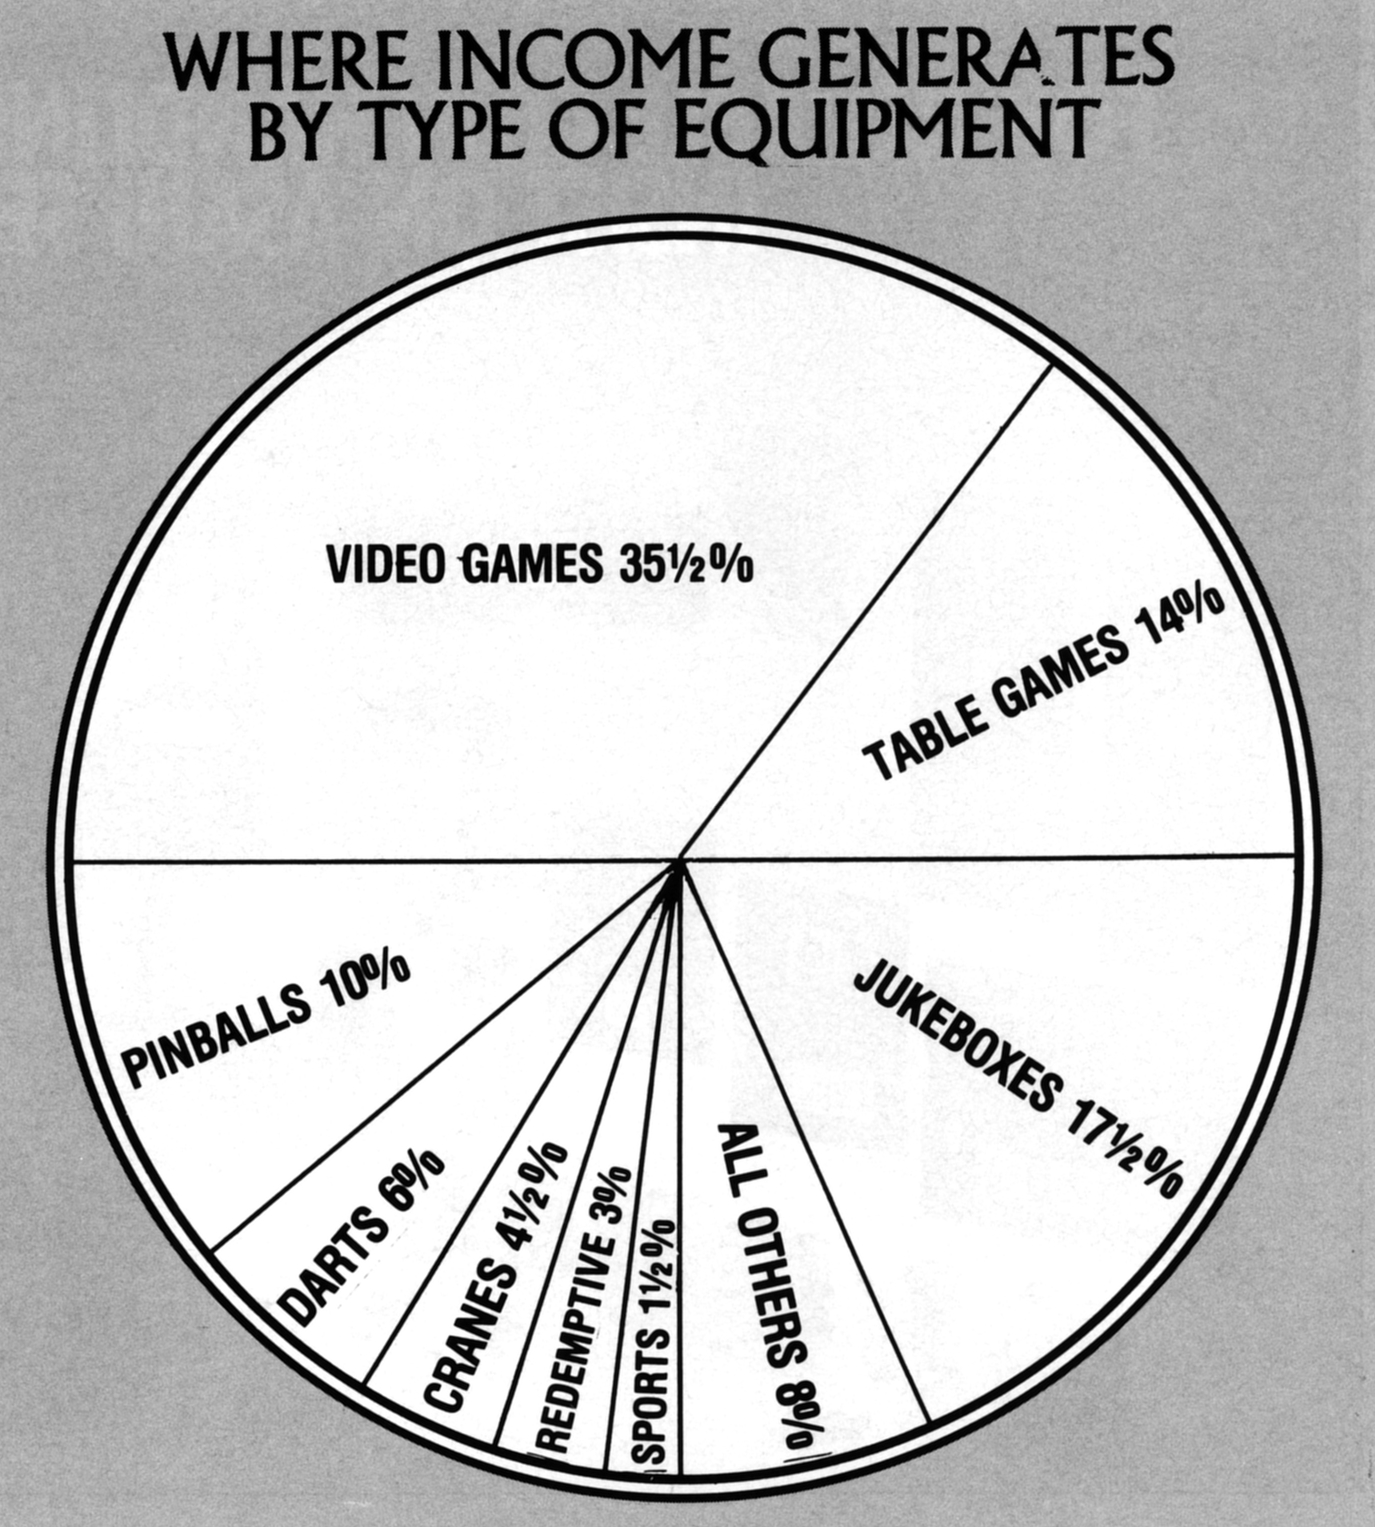
The brief drop in sales in nothing to get concerned about…. Probably. Honestly though, the first year of the radical decade didn’t have a lot of standout games, save for Smash TV (or Pit Fighter, if you like that sort of thing). Tracking in general became a lot less precise that year, probably with the worrying threat of Nintendo at their height about to utterly destroy all that we knew and loved about the arcade industry (so they said). It would persist though, and some huge new games were about to give the arcade a hurrah which would put them into the cultural spotlight one last time.

Coin-op Video Game, New Units Purchased: 270,000 [85,000 dedicated video games, 185,000 kit video games] (1992 Play Meter Directory)
Overall Coin-op Video Games on Location: 1.2 million video games (1992 Play Meter Directory)
Coin-Op Video Game Profit: $2.5 Billion (1992-08 Replay pg 38)
What do you get when you combine Street Fighter II, The Simpsons, Terminator 2, and the first full year of the Neo Geo to revolutionize street locations? You get the greatest year the video game arcade has experienced since 1983.
Steaming ahead of the new war of 16-bit consoles, the arcades showed what they had on their side this year. Virtual reality even entered the scene for the first time, though it was cumbersome and too expensive to ever take significant market share. For the first time in a long while, individual revenue take for video games was tracked and it looked incredibly rosy, sitting on top of a $7 billion industry.
Of course it is pertinent to note that the massive adoption of kit-based games was revealing that the growth potential for video games was totally stagnant. Things had just about hit their limit and that would mean that video games would have to entice operators to replace their old models or there was room for other types of coin-operated amusement to chip into that space.

Coin-op Video Game, New Units Purchased: 173,000 video games (1993 Play Meter Directory)
Overall Coin-op Video Games on Location: 1.2 million video games (1993 Play Meter Directory)
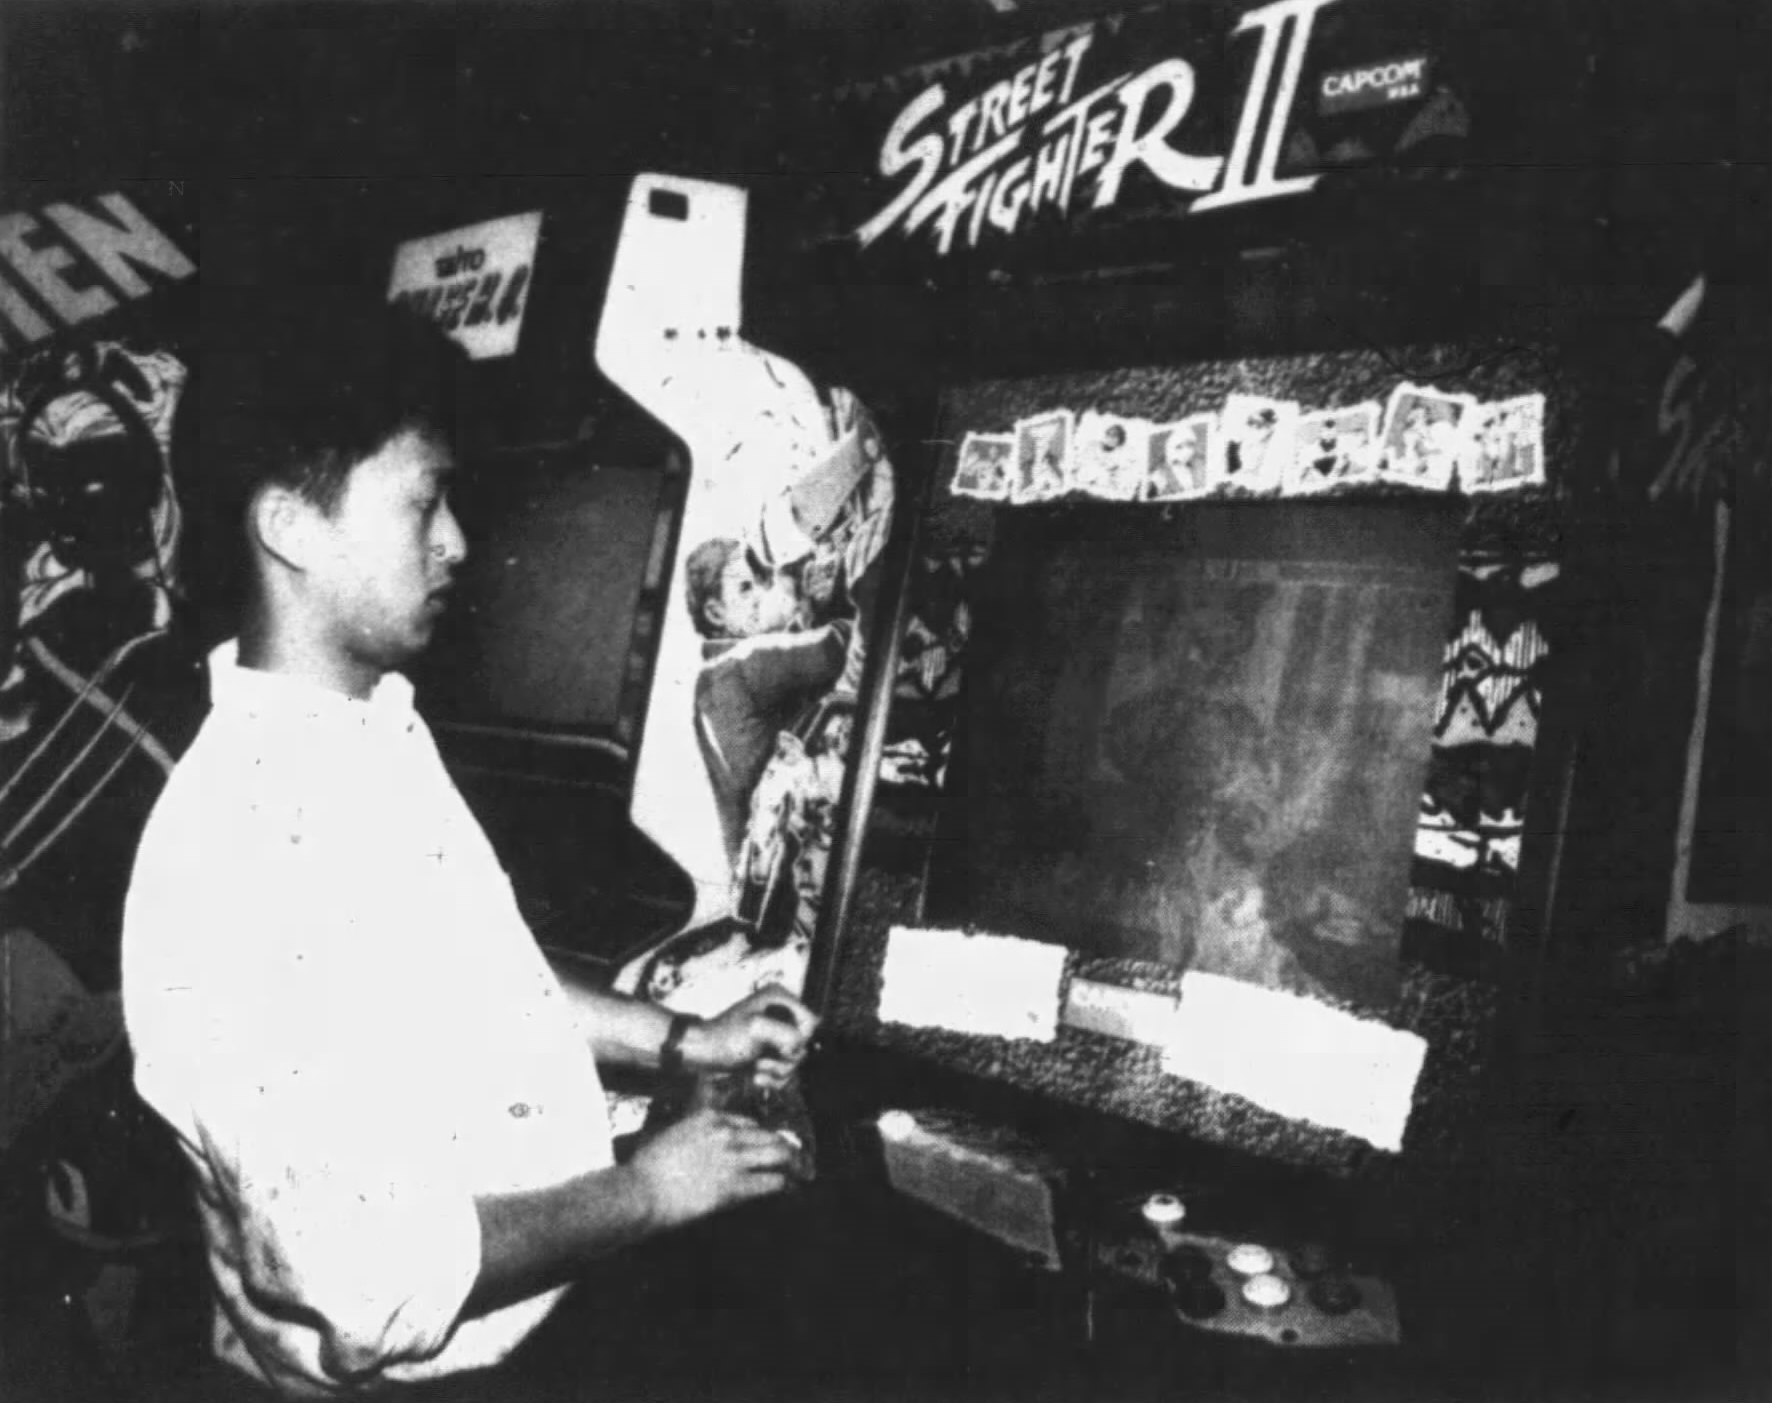
It’s a myth that Street Fighter II “saved” arcades. It was a new trend, a hot one at that, but the arcade market was all dressed up with nowhere to go. The new offerings by manufacturers were not remotely enticing enough to change what was already present, but it appears on the front of profit, things were steadily increasing. Sales of new video game units went into massive decline because of the maxed out market and it seems like the focus on the looming home video games may have signaled another declining period of interest for analyzing the coin-op story.

Overall Games on Location: 1 million+ video games (1994 Play Meter Directory)
The lack of figures for 1993 in video games has largely to do with a new obsession for the coin-op trades: Video poker. With many states beginning to legalize digital poker machines, there was some question about how this fit into the coin-op ecosystem. Was it a subsection of video games? Was it really gambling in the traditional sense, which generally was not focused on by the amusement trade?
They were so lazy they couldn’t even bother to do an exact count, only that the video game presence was over a million. Likely things didn’t decrease and the picture probably looked like solid growth for the year, if not escalating quite as fast as envisioned by the massive successes of Mortal Kombat and NBA Jam. The industry was running out of ways to dazzle and intrigue.

Coin-op Video Game Income: $4.2 Billion [$3 billion dedicated video games, $1.2 billion kit video games] (1995 Play Meter Directory)
Overall Games Coin-op Video on Location: 1.265 Million [765,000 dedicated video games, 500,000 kit video games] (1995 Play Meter Directory)
Picking things back up in 1994, things look rather rosy with a steady growth over three years with a renewed interest in video game income and the hottest year for video since the industry crash. $4.2 billion for video games was a nice showing, but looking at the games on location reveals a worrying fact that growth was very limited. Indeed, operators this year were complaining especially of the cost of cabinets, meaning that their input wasn’t yielding a particularly high return in comparison. The industry had totally maxed out and there was about to be a massive rebuking of the stagnant state of video games.

Coin-op Video Games, New Units Purchased: 82,000 [37,000 dedicated video games, 45,000 kit games] (1996-01 Play Meter)
Coin-op Video Game Profit: $3.7 Billion [$2.5 billion dedicated video games, $1.2 billion kit video games] (1996-01 Play Meter)
Overall Coin-op Video Games on Location: 885,000 [500,000 dedicated video games, 385,000 kit video games] (1996-01 Play Meter)
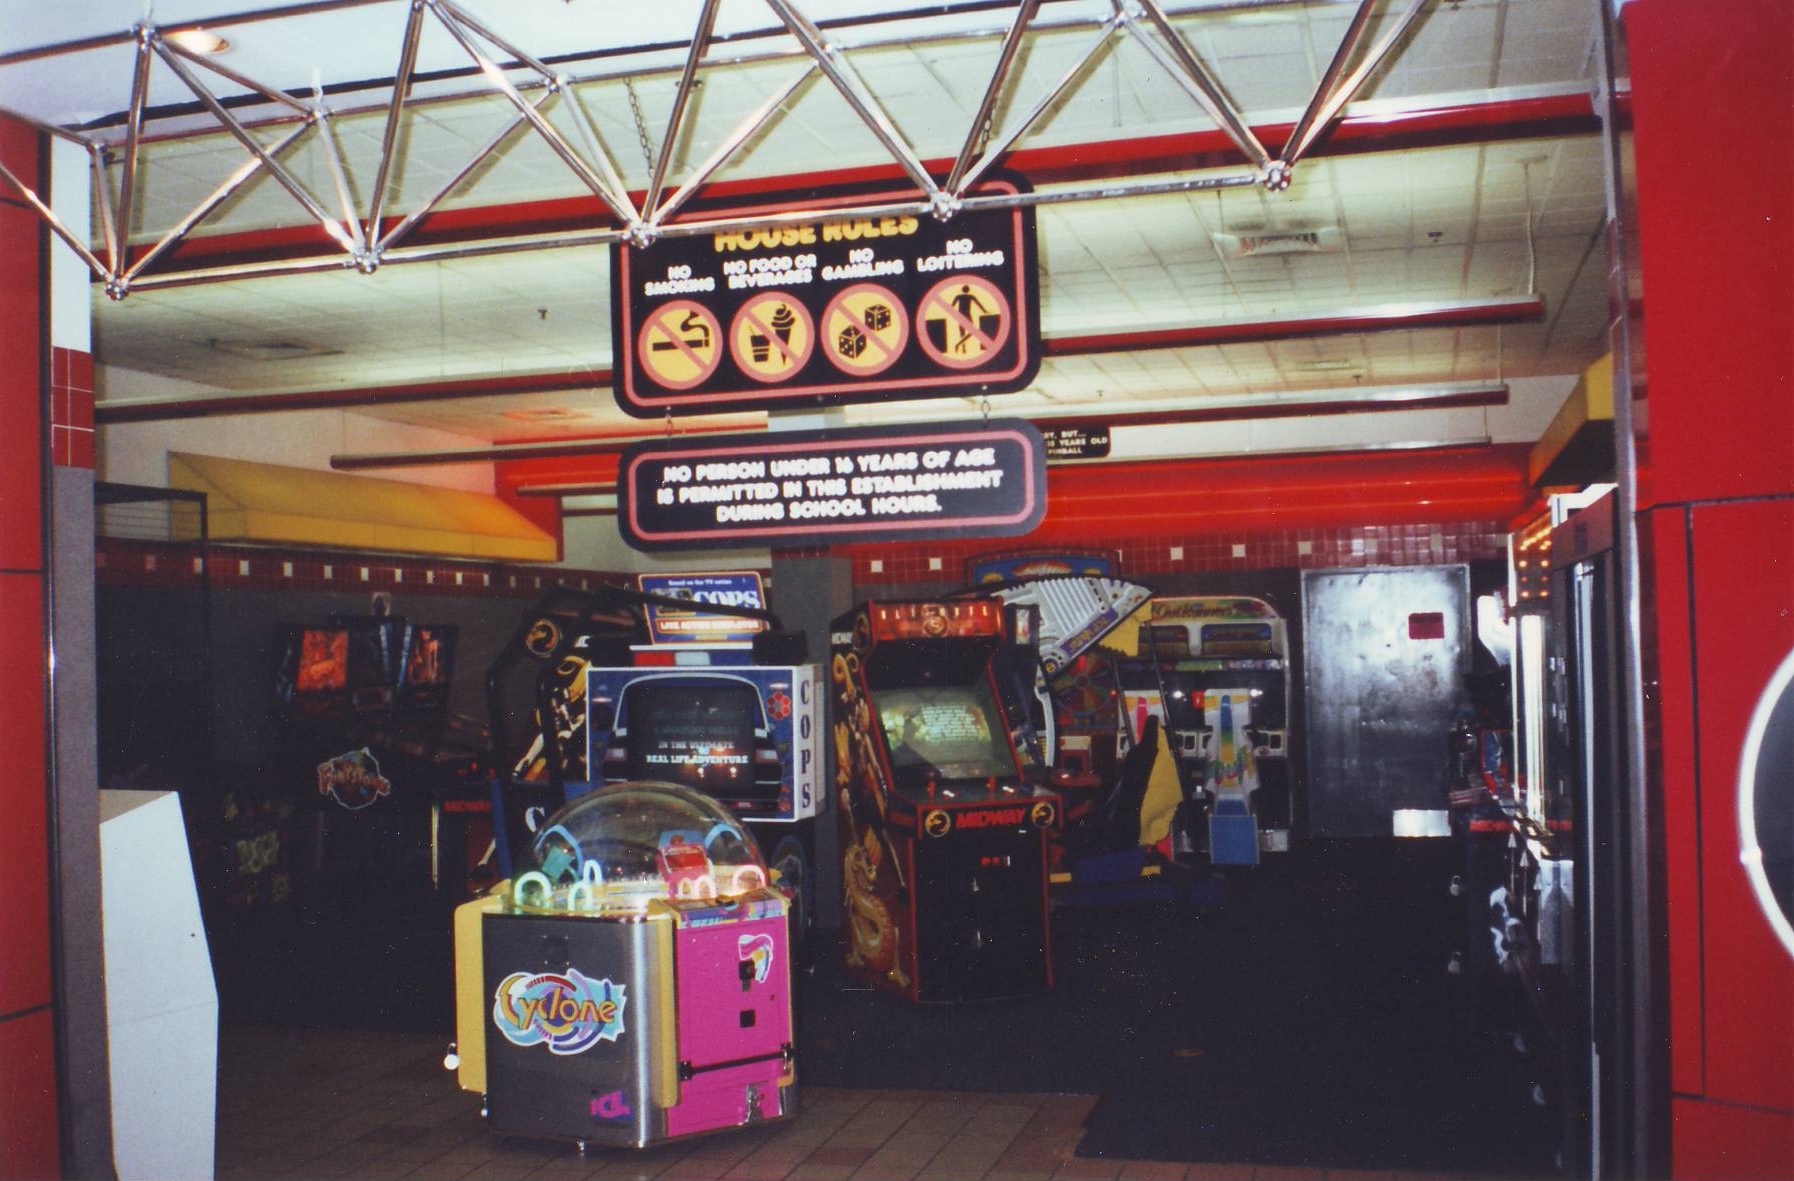
The bottom fell out of the video game portion of the market extremely quickly. With the full-on adoption of 3D games like Tekken, Ridge Racer, and Virtua Cop you would think there would be an uptick in interest to the arcade to experience polygonal graphics. However, it seems that there was a mass dumping of video games not at all equaled by new orders. There was not the swell of interest in the United States – at least for street locations, which continued to be the largest portion of the market – to continue to attract players. Cabinets were getting more expensive and the home market seemed to be enough for the less obligatorily social child of the 1990s.
This fall was not equaled by a total loss in profit though, a big relief for the small time operators. What was in the future though was a decline, and no attempts at virtual reality or anything else was going to save them. The interest once reserved for pinball and video games was shifting over the redemption which yielded greater profit per minute than anything the industry had seen before. Video had a presence for a while yet, but anyone paying close attention would know it wasn’t to last.

Coin-op Video Games, New Units Purchased: 79,000 [34,000 dedicated video games, 45,000 kit games] (1997-01 Play Meter)
Coin-op Video Game Profit: $3.6 Billion [$2.3 billion dedicated video games, $1.3 billion kit video games] (1997-01 Play Meter)
Overall Coin-op Video Games on Location: 835,000 [470,000 dedicated video games, 365,000 kit video games] (1997-01 Play Meter)
A steady decline is a financial person’s worst nightmare. Relative stability in sales and profit belies the fact that more locations were dumping video games for different kinds of arcade machines. Pinball was dead and the great dream of video poker had become just a small part of a wider gambling industry. The most exciting days of the arcade were over, but that didn’t mean it all had to fall apart, and even through the worst times the coin-op industry has remained viable.

Coin-op Video Games, New Units Purchased: 81,000 [43,000 dedicated video games, 38,000 kit games] (1998-01 Play Meter)
Coin-op Video Game Profit: $2.853 Billion [$1.9 billion dedicated video games, $953 million kit video games] (1998-01 Play Meter)
Overall Coin-op Video Games on Location: 657,600 video games [384,000 dedicated video games, 273,600 kit video games] (1998-01 Play Meter)
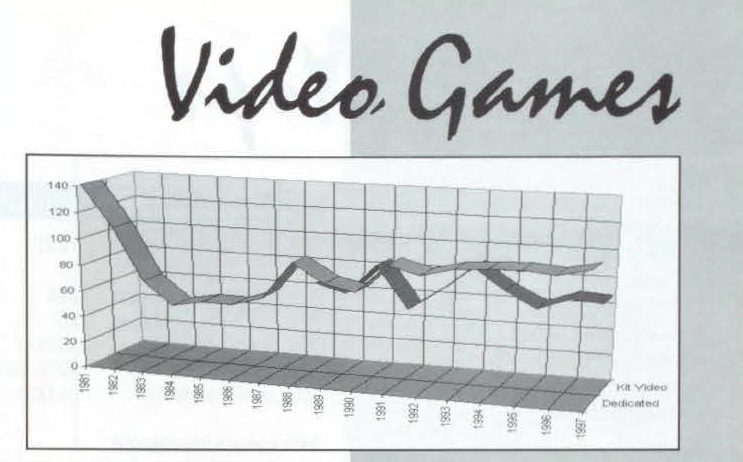
Surprisingly, in 1997, the trend of kit game numbers eclipsing dedicated sales flipped for this brief moment. Was this the result of a hit game? Had the operators run out of arcade cabinets that they could convert? Were the arcades saved? Probably no to all of those as the trend would resume in the following year, but it may have been due to a last gasp of large scale games (later called simulators) having a predominant place in arcade video games.
Despite more expensive cabinets being sold, profit and number of games suffered another brutal hit in this year. Down almost $1 billion in take and 200,000 cabinets respectively, video games relied on their high earnings to maintain relevance to the industry. The slide into oblivion is not particularly fun to document, but hopefully it will explain why where once arcades dominated North America, they have fallen so very far.

Coin-op Video Games, New Units Purchased: 87,000 [40,000 dedicated video games, 47,000 kit games] (1999-01 Play Meter)
Coin-op Video Game Profit: $3.1 Billion [$1.9 billion dedicated video games, $1.2 billion kit video games] (1999-01 Play Meter)
Overall Coin-op Video Games on Location: 692,000 video games [364,000 dedicated video games, 328,000 kit video games] (1999-01 Play Meter)
An uptick? Quite a surprise. Or, if you’re old enough to remember the year of Marvel v Capcom, Radiant Silvergun, and Star Wars Trilogy Arcade, maybe not. Not to overstate things, but 1998 was one of the last years that the sophistication of arcade multiplayer outpaced the still agonizingly slow internet speeds of the World Wide Web. This plays a factor inasmuch as console power does, providing less incentive to visit the arcade for social interaction.
There was a brief jump in buying of new video games instead of redemption-style ones, at least in kit form. The new types of games coming out were far more suited to the intense action of an arcade rather than a convenient store or a location with a small number of cabinets. Adopting mostly racing games, fighting games, and light gun games plays its own role in the lessening interest for arcade video games by a larger public outside of the hardcore.

Coin-op Video Game Profit: $3.069 Billion [$1.3 billion dedicated video games, $1.1 billion kit video games, $669 million simulators] (2000-01 Play Meter)
Coin-op Video Games, New Units Purchased: 77,500 [31,700 dedicated video games, 33,000 kit games, 12,800 simulators] (2000-01 Play Meter)
Overall Coin-op Games on Location: 571,000 video games [243,000 dedicated video games, 262,000 kit video games, 66,000 video game simulators] (2000-01 Play Meter)
Ending this look into the arcades on a slightly hopeful note, at the end of the millennium there were the flagging throes of interest in what were called ‘Family Entertainment Centers’ or FECs. This includes the likes of Dave & Busters which is still around today, but also other types of massive arcade halls like Sega’s GameWorks. These types of locations featured what the trade press called ‘simulator’ games which often had ride-like qualities like the ability to spin around. These had been invented much earlier but only became their own category now.
They were already present enough that they are just a separate category of dedicated video games, but interest in the category did spur a substantial (for this time) number of sales which kept video games on a neutral revenue stream. All this would make up for the fact that another wash of video dumping left them less and less present in small locations across the United States.
The arcade industry has never been stable, even way back into the days before pinball was a thing. One has to be hearty to follow those ebbs and flows and to the current day the arcade market persists despite its cultural relevance being in an eddy at the moment. It’s still fascinating to see how the coin-op industry’s fortunes have changed and shaped video games along the way.
Handhelds
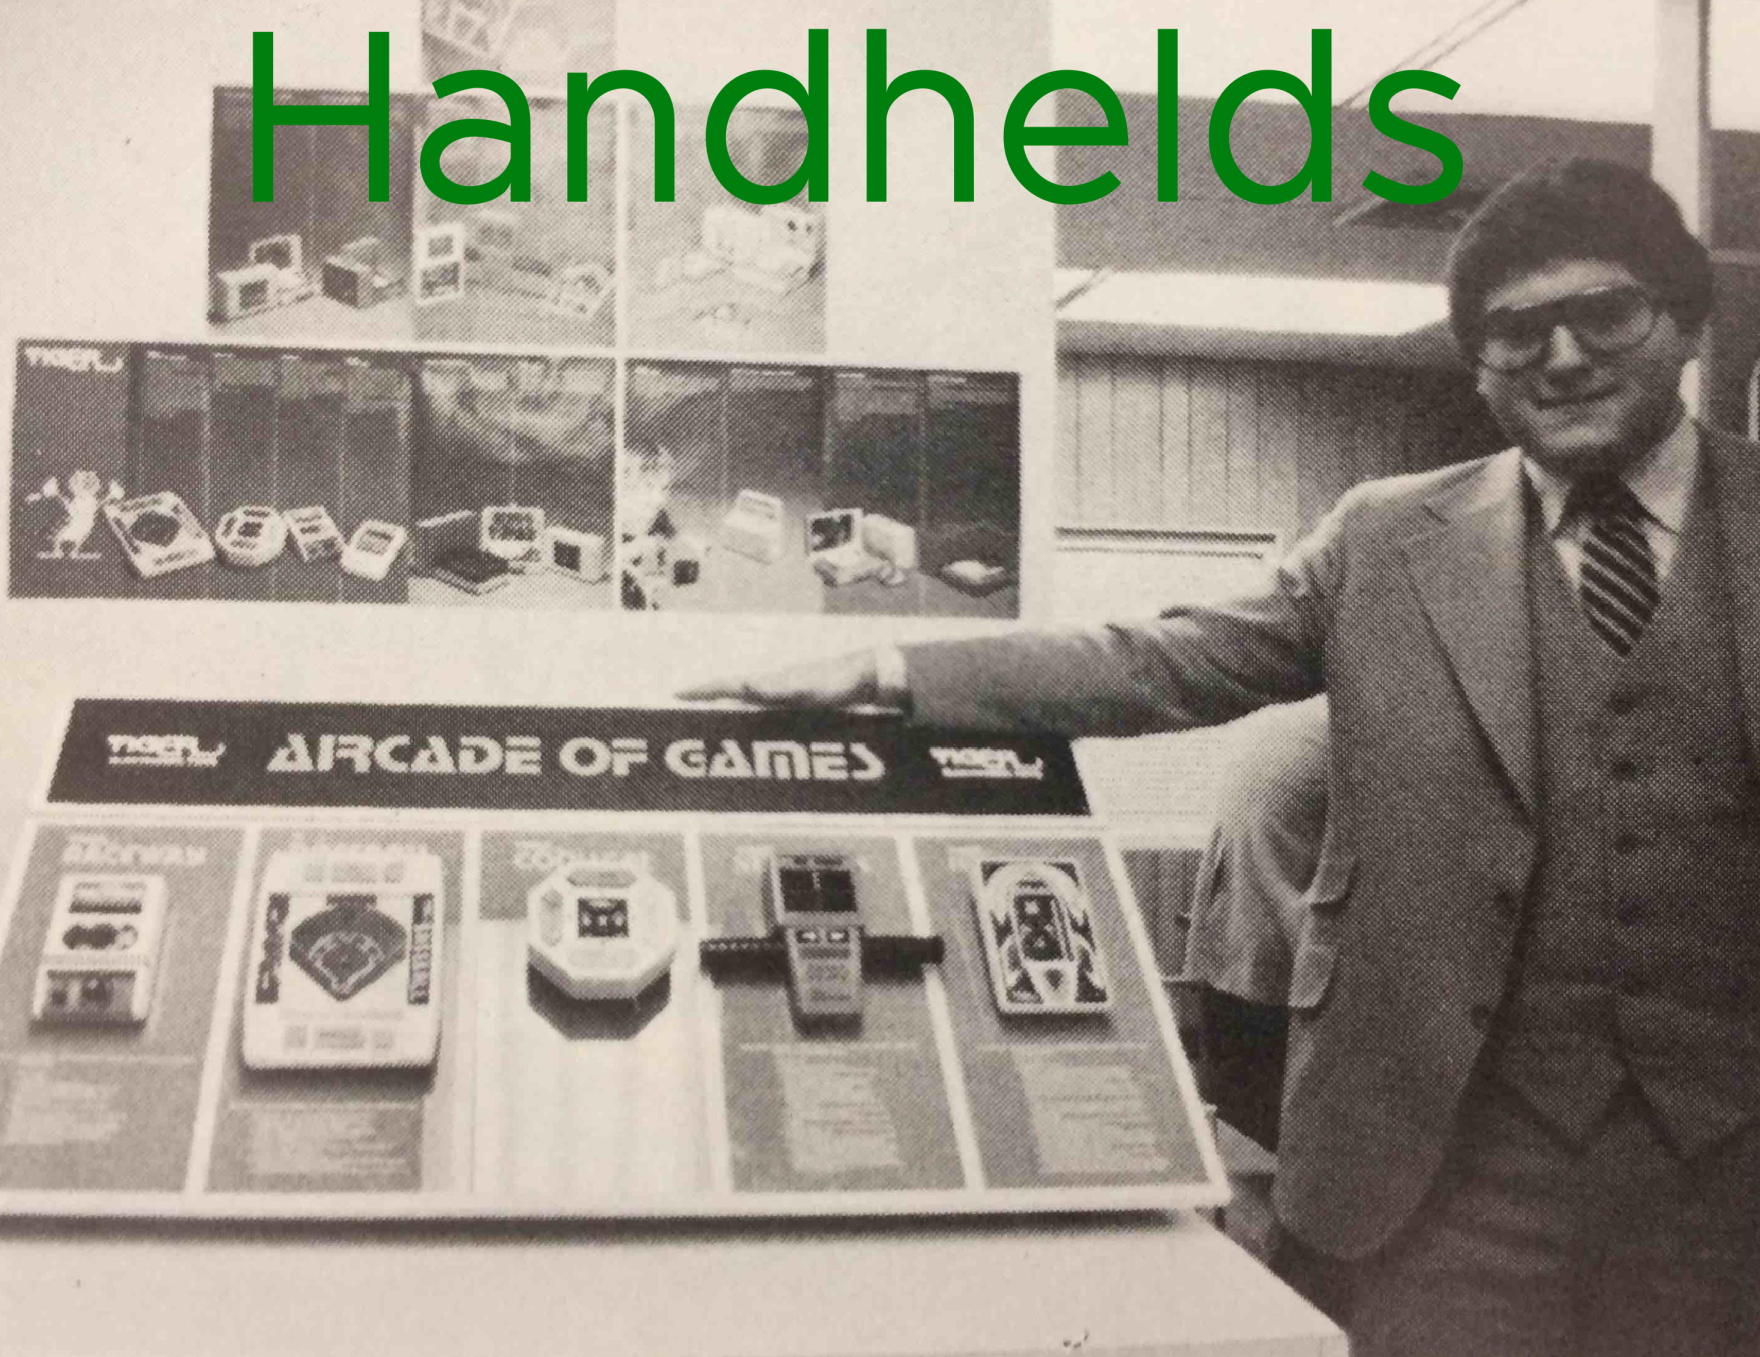

Electronic Game Units: 2 Million (1979-03 Home & Coin Operated Electronic Games)
Electronic Game Revenue (Unspecified): $20 Million (1981-12-06 Fort Worth Star-Telegram pg 4H), $21 Million (1981-02-15 The Record (Hackensack) pg E-19)
Electronic Game Revenue (Wholesale): $21 Million (1981-06-15 New England Business)
Electronic Game Revenue (Retail): $35 Million (1978-11-13 Wall Street Transcript), $40 Million (1979-03 Home & Coin Operated Electronic Games)
The first year of the handheld market, despite some claims that it began the prior year. Several toy companies came upon the idea at much the same time, creating both calculator-style devices to play new games and electronic versions of board games. While we are primarily interested in these dedicated handhelds, note that sometimes figures do not specify whether they mean these ‘video game’ devices or anything that can be considered an ‘electronic toy’. We’ve curated as best we can to not include talking dolls or something like that.
The most surprising thing out of these early figures is perhaps how strong the figures were in comparison to console sales, which were around 6 million at the time. Interest in electronics spurred a lot of buying and for toy retailers they were much happier to carry items which cost $30 to the consumer as opposed to $70 or higher. This brings up another point that retail revenue was extremely high on these games, but perhaps not so much at the very start if the figures here are to be believed. It all must start somewhere though and the electronic game category was eager to make its mark.

Electronic Game Units: 3.68 Million (1979-05 Merchandising), 6 Million (1979-03 Home & Coin Operated Electronic Games), 15 Million (1979-11-14 The Courier-Journal (Louisville))
Electronic Game Revenue (Unspecified): $112 Million (1979-10-14 Fort Worth Star-Telegram pg 1I), $115 Million (1981-12-06 Fort Worth Star-Telegram pg 4H)
Electronic Game Revenue (Retail): $120 Million (1979-03 Home & Coin Operated Electronic Games), $125 Million (1979-02-13 The Courier-News pg A8), $140 Million (1978-11-13 Wall Street Transcript)
In 1978 there were plenty of companies throwing themselves into the new electronic game category, but how many units were covering the walls of toy retailers seems to be in contention. We’ve seen some ridiculous growth figures in these lists, but seven times growth may just be a bit too far. Supporting this, the retail figures compared to the prior year match up more closely with the 6 million figure, likely meaning that the 15 million was an exaggeration.
The general spectrum of revenue – which we will assume is all retail – goes across a range hovering around $120 million. That numbers seems to be about right, though it’s interesting how the numbers almost all come from the singular year of 1979 which indicates some sort of source being drawn from which doesn’t appear to be the market survey we have. Electronic games had made their statement and were forging ahead on a new segment for computerized games in the toy industry. The category was just starting to heat up.

Handheld Game Units: 15 Million+ (1980-11-30 The Sunday News (Ridgewood) pg RC20)
Handheld Revenue (Unspecified): $375 Million (1980-06-08 The News and Observer pg 12-IV, 1981-12-06 Fort Worth Star-Telegram pg 4H)
Handheld Revenue (Wholesale): $375 Million (1982-03-01 New England Business)
Unfortunately we don’t have super detailed numbers for the rising star of electronic handhelds, but it’s possible that 1979 was the peak year for overall units of handhelds put out into the wild. The vague number of “more than 15 million” may well be accurate and represents an explosion from the prior year that ignited the flame under the toy industry to accept electronics. Interestingly enough, this confidence may have played a part in the downfall of this market.
Interestingly the reporting would also shift from the standard of retail sales being talked about in the console industry to wholesale numbers for manufacturers. This may have been because the market was split across a wider number of companies, meaning that the take of the whole industry was a bit more relevant. This is just a guess though, and retail numbers wouldn’t disappear.

Electronic Game Units: 2.5 Million (1981-02-15 The Record (Hackensack) pg E-19)
Electronic Game Revenue (Unspecified): $476 Million (1981-12-06 Fort Worth Star-Telegram pg 4H), $800 Million (1981-08-28 The Oshkosh Northwestern pg C5), $1 Billion (1981-02-15 The Record (Hackensack) pg E-19)
Handheld Revenue (Wholesale): $476 Million (1981-06-15 New England Business, 1981-11-25 The Parsons Sun pg 24), $480 Million (1982-03-01 New England Business)
While it might be tempting to say that the estimates here were overblown in their collapse, the revenue figures actually reflect something interesting about the market. During the shift in the primacy of consoles in 1980, there was also a shift of electronic games to become more expensive and feature-complete. This was still not going into the realm of full blown computers or consoles, but slowly creeping up from the $30 price point introduced in 1977 towards more like $100.
It’s probably unlikely that things dropped off nearly 800% and that the figure may not have been reflecting the same market parameters of prior years, but by all accounts 1980 was a turbulent year for electronic games. Retail sales piled up to maybe $800 million on the back of $476 million from the manufacturers, but there was a large amount of discounting starting to overtake the industry. There was no bright future for electronic handhelds in the wider toy industry, but the integration of electronics will have made its mark.

Handheld Revenue (Wholesale): $276 Million (1982-02-24 The Shreveport Journal pg 14c)
By the end of 1981, many toy retailers were throwing up their hands and wanting to forget about the handheld electronic category. While it wasn’t totally dead and the following year would see a rebound, as we saw with the video game market and year of dropping half the value stings very harshly for retailers. Alas this is all the information we have to go on other than to note that many companies did exit from the market and would not re-enter it in the subsequent years.

Electronic Game Revenue (Unspecified): $371 Million (1983-12-04 Arizona Republic pg G8)
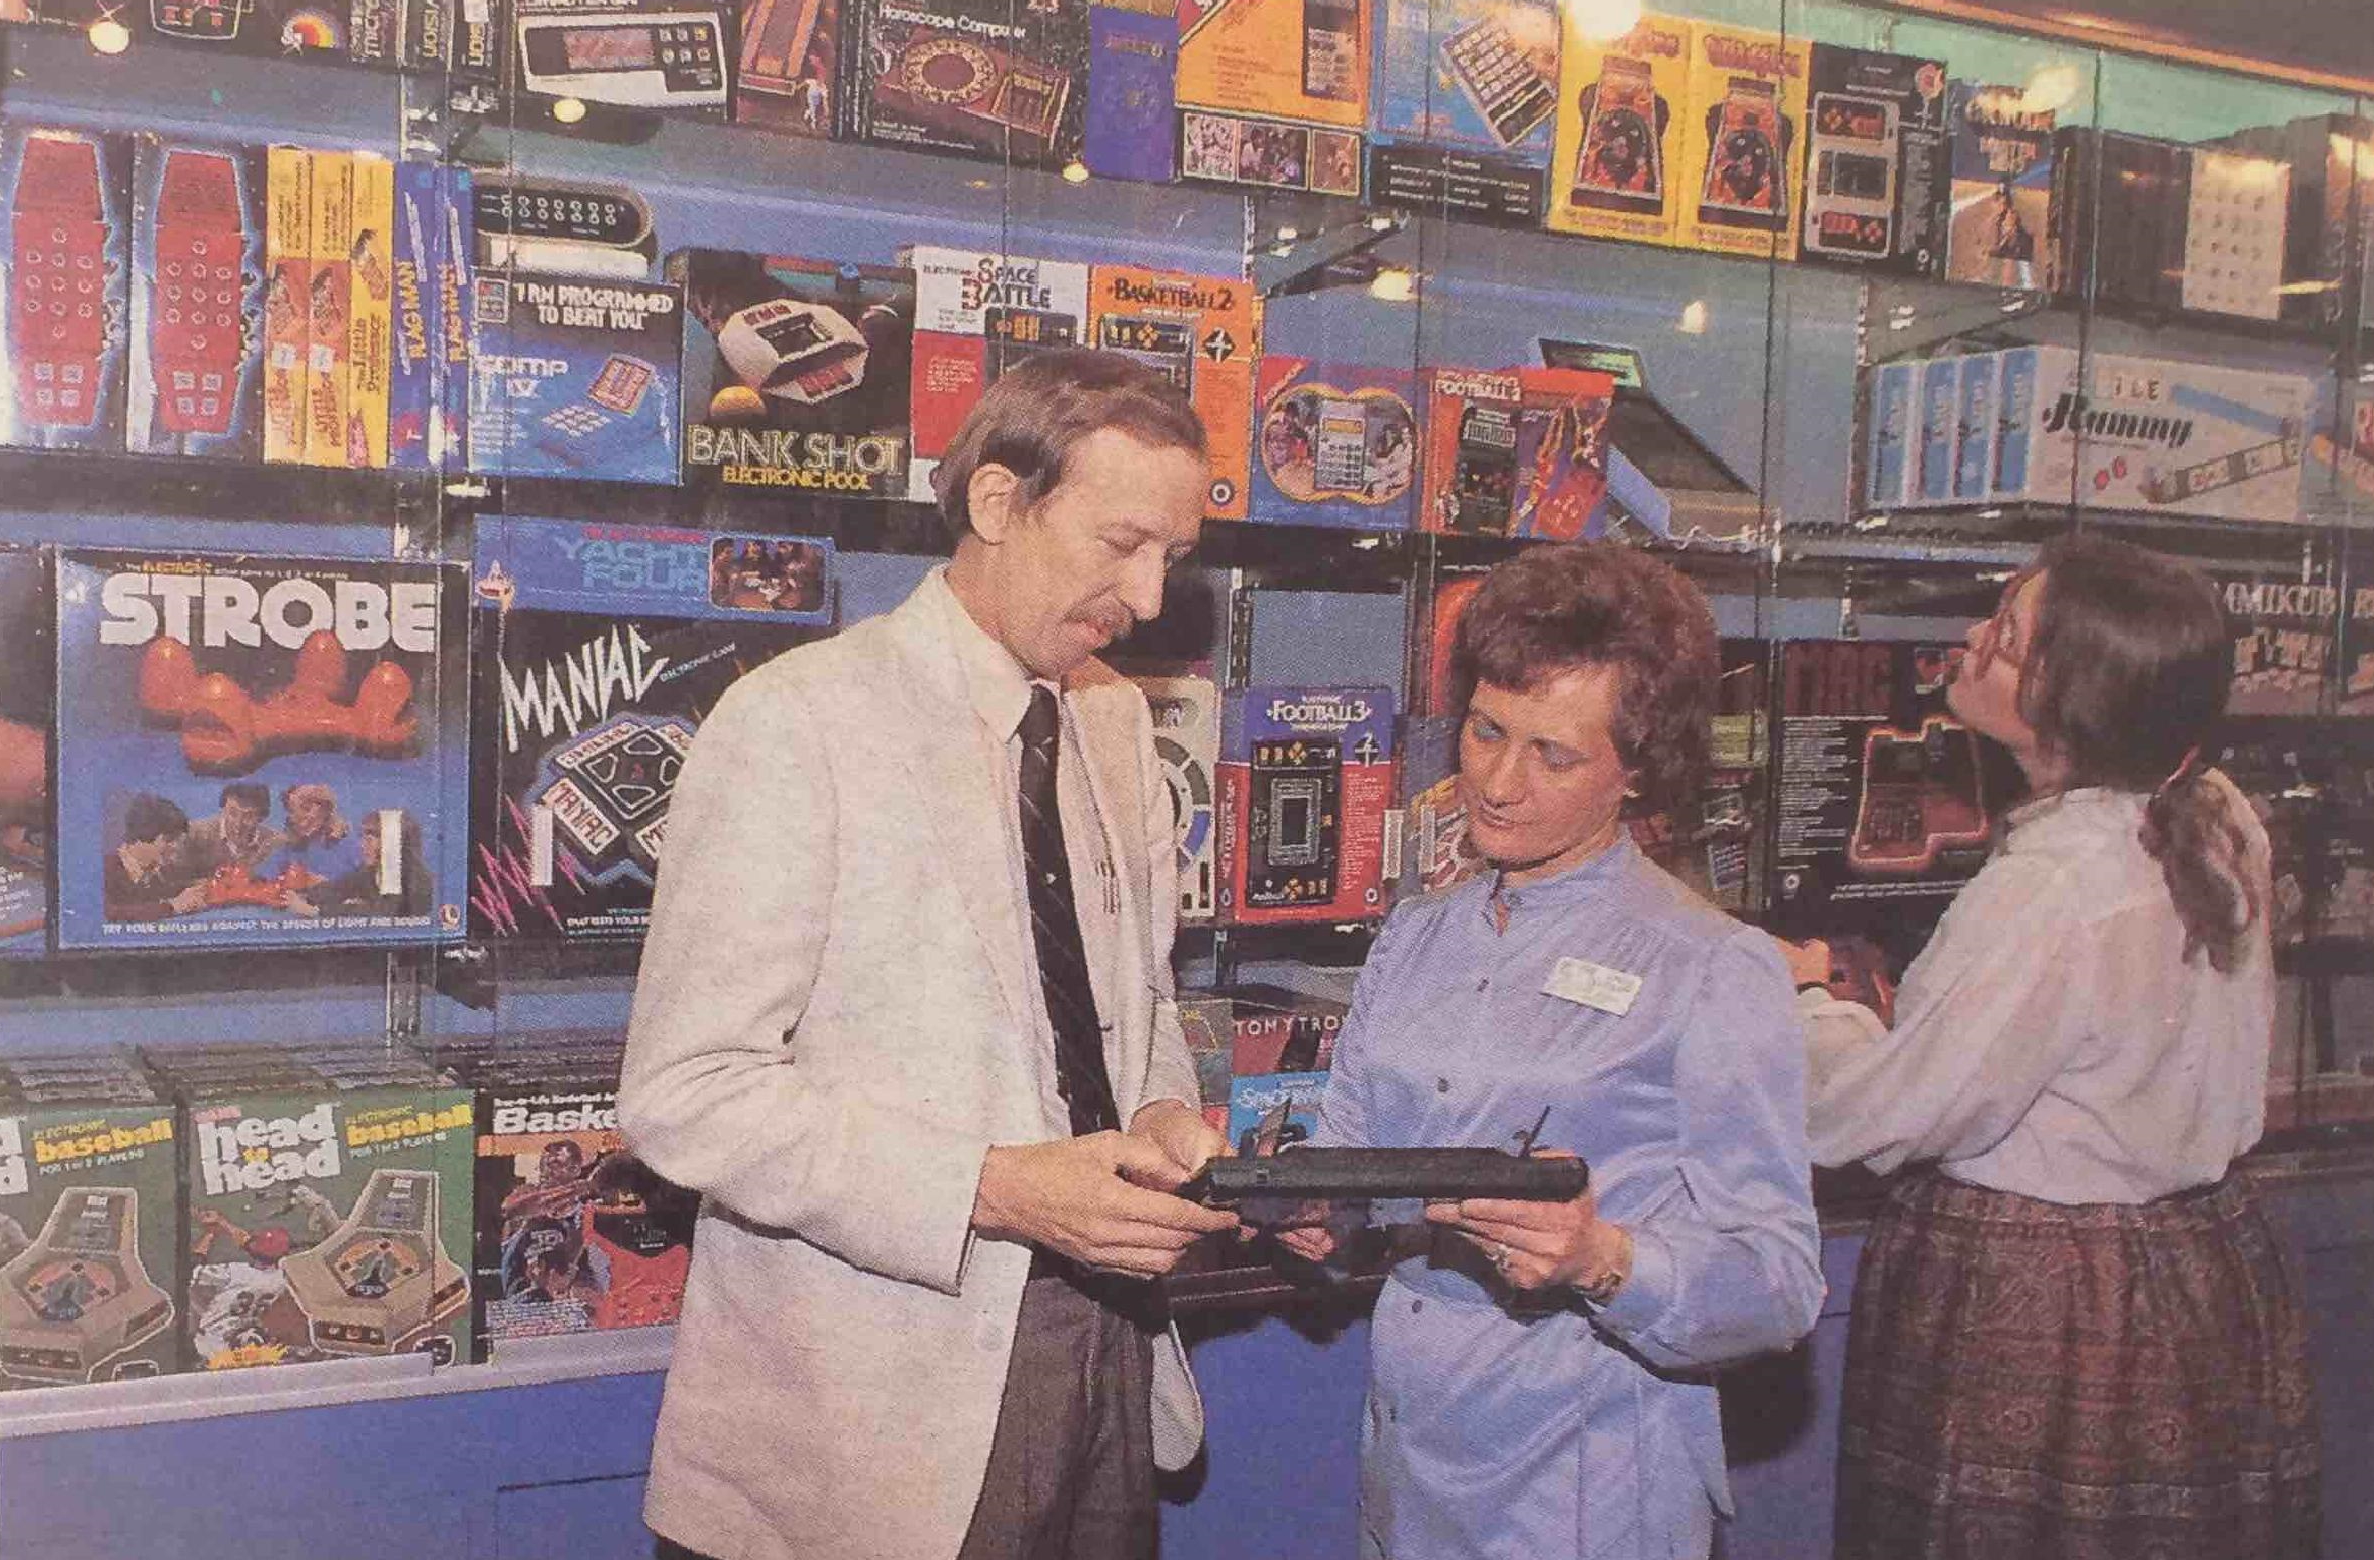
A small rebound occurred for electronic handhelds in 1982, but only to the level of 1979 sales, probably with fewer units on the market. The electronic games did make up a comfortable low end that families who could not strictly afford an expensive video game system, and as an effect of the North American Video Game Market Crash they would become even cheaper. There were a few notable successes in this year like Coleco’s Mini-Arcades but in general the electronic integration of board games seemed to be more popular in the toy world.
With the bottoming out of the console market, there was no real room for the reporting on electronic handhelds. There were a few interesting innovations along the way, but not until the single handed revival of the sector with Nintendo’s Game Boy in the late 80s did the idea become viable again. It appears in some reports handheld games were integrated into “home console” market sales, so we have to wait 13 years until we get a separate category for them in tracking once again.

Handheld Console Revenue (Unspecified): $148 Million (1998 Key Trends in the Video Game Industry)
Handheld Game Revenue (Unspecified): $159 Million (1998 Key Trends in the Video Game Industry)
When the NPD picked up its reliable tracking in 1995, they were collecting numbers for handheld games. However it seems initially they were putting these into larger reports, rather than separating them as a category, until 1997. Even if that was the case, the $300 million in total revenue doesn’t make much of a dent in the $3 billion that the consoles were making at this time.
Of course much has changed since the last poll. The handheld sector – at least that’s being counted – is programmable and almost entirely dominated by the original Game Boy. Competitors have nearly completely faded out of sight and this would be the state of things for the rest of our numbers at the moment. Hard to tell whether the revenue reflects wholesale or retail sales, but either way the static market had seen a drastic reduction in relevance nearly two decades after their introduction.

Handheld Console Revenue (Unspecified): $102 Million (1998 Key Trends in the Video Game Industry)
Handheld Game Revenue (Unspecified): $113 Million (1998 Key Trends in the Video Game Industry)
The market suffered an even greater slump in the following year. There really was little compelling reason to own a Game Boy or any dedicated handheld console beyond the back catalog, and that in itself was little incentive for repeat buying. This was the case in the United States at least. In Japan the release of Pocket Monsters Blue had completely reinvigorated the Game Boy market, but it would take two more years to reach American shores. In the meantime, the market would remain a consistent money maker at extremely little cost.

Handheld Console Revenue (Unspecified): $109 Million (1998 Key Trends in the Video Game Industry)
Handheld Game Revenue (Unspecified): $125 Million (1998 Key Trends in the Video Game Industry)
Cutting off right before the Pokémon revolution, the market barely moved its needle even with the release of some impressive late-era Game Boy games in that year. It was fine and dandy to have good Donkey Kong Land games and Game and Watch Gallery releases, but much of the original flavor of the Game Boy had been lost. While the numbers for handhelds currently ends here, do not be surprised if we revise this section and handhelds explode in the final two years of the millennium.
Thanks very much for checking out this article! Those who make it to the end are especially beautiful.
As mentioned at the start, this article is only the beginning of applying well-sourced research to bigger stories about the video game industry. Feel free to take this data and do what you please with it, contact us with further information or any questions, or just keep it in the back of your mind when discussing video game history.
Special thanks to Alex Smith of They Create Worlds for providing many of the rare market research materials for the information reproduced here.
All the best from us here at Gaming Alexandria!


One thought on “Video Game Sales: 1972-1999”